US Weather Advisories:

Current Hemispheric 500 Millibar & Surface Analysis:
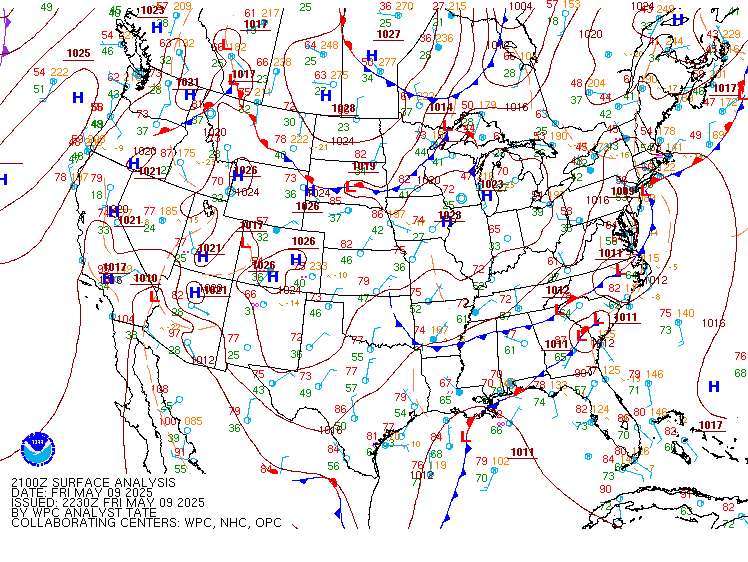
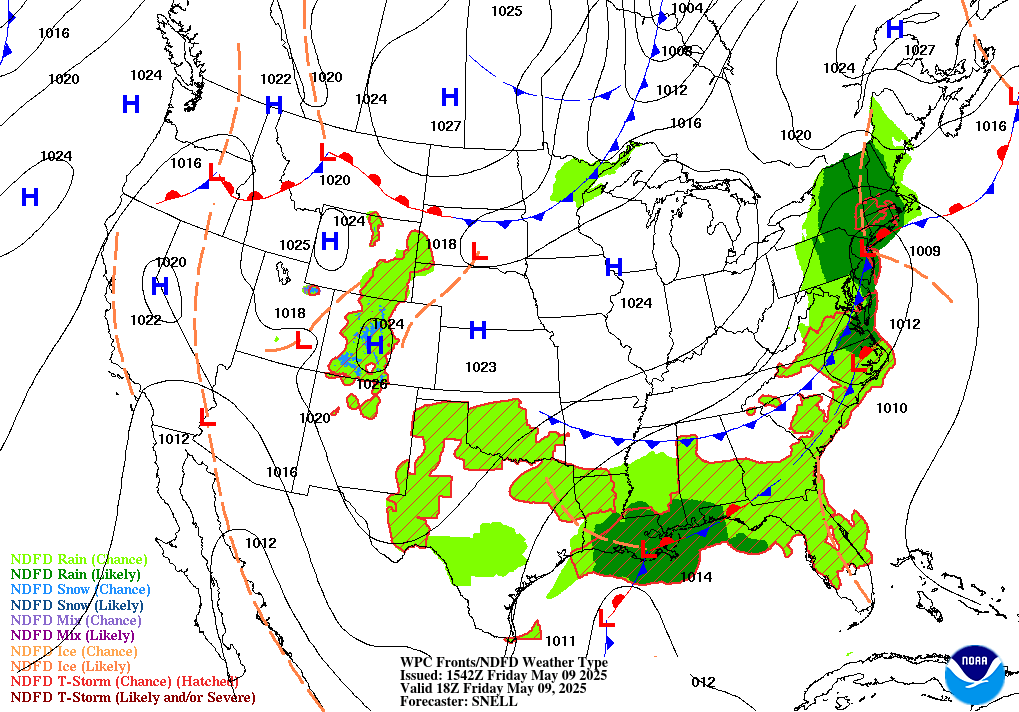
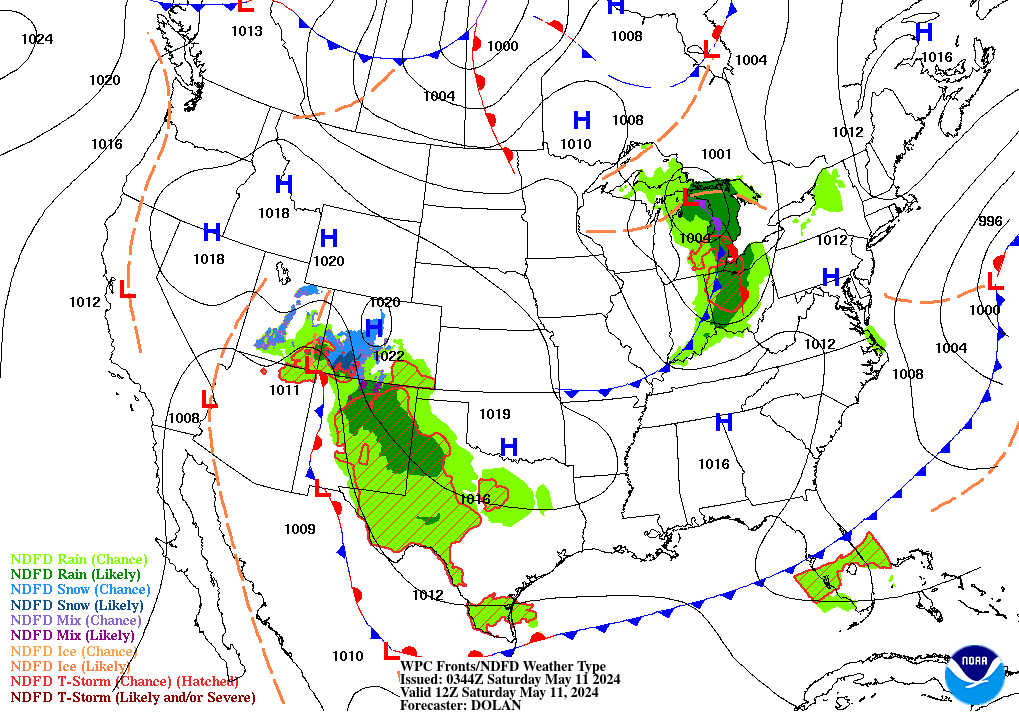
Current US Surface Weather Map
Hourly Mesoscale Analysis

Current National US Radar Composite
1km High Resolution Satellite and Radar Images
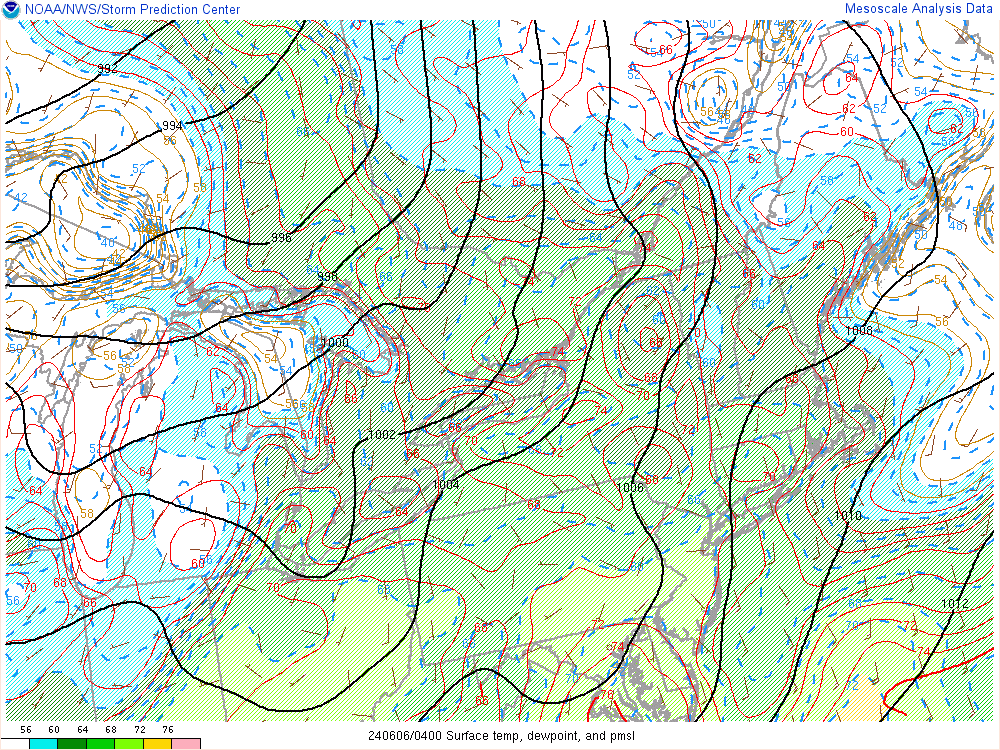
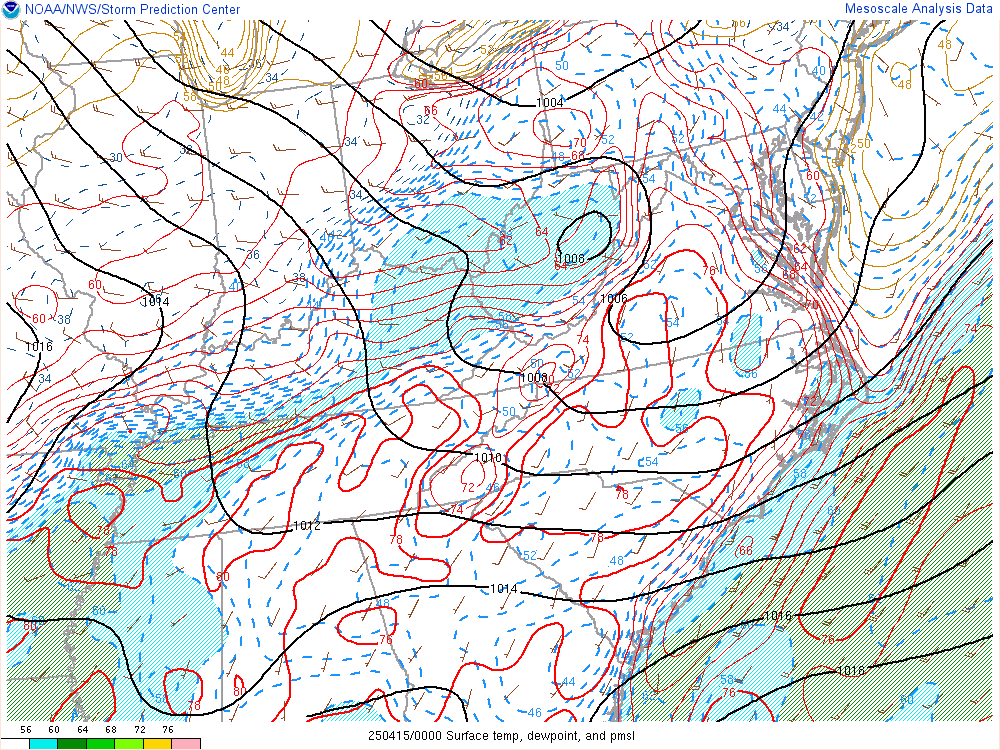
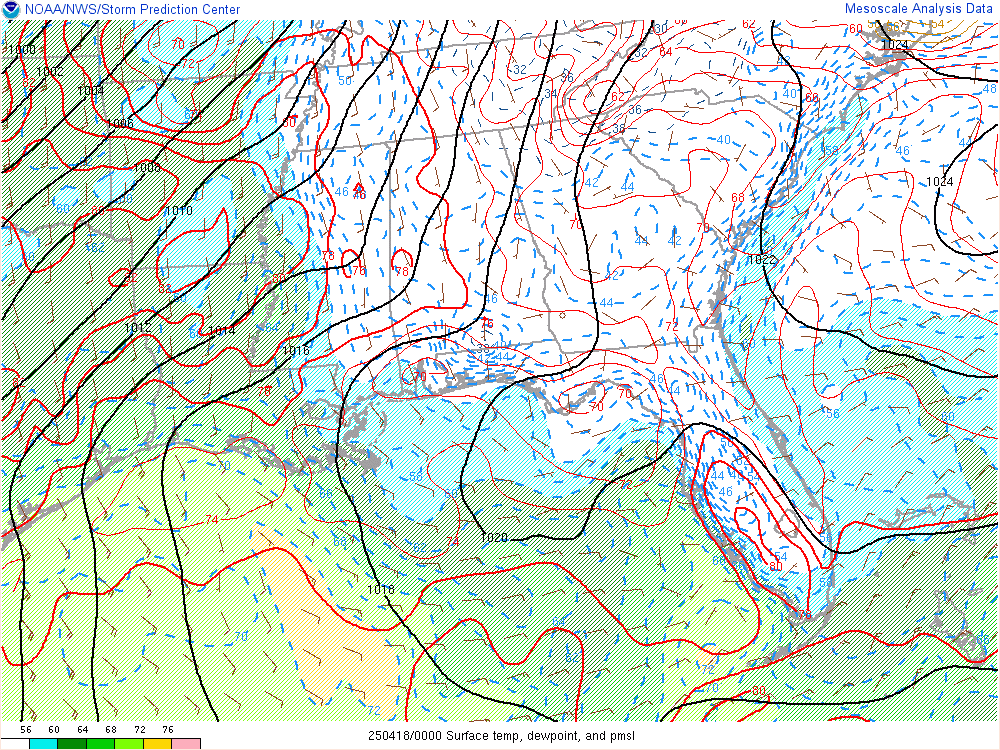
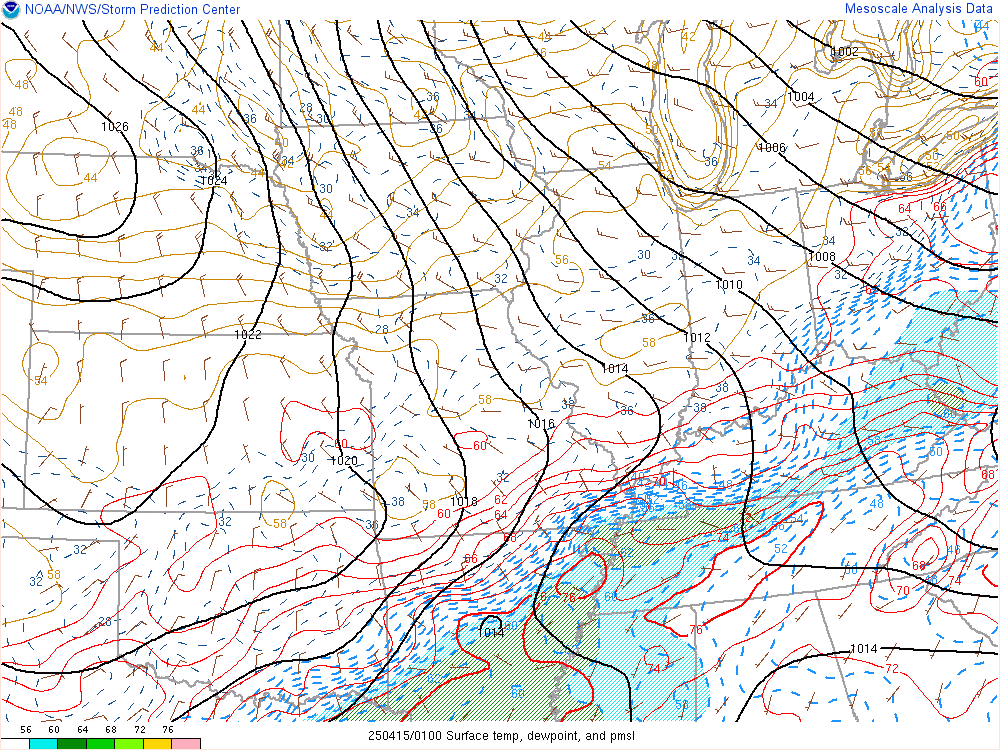
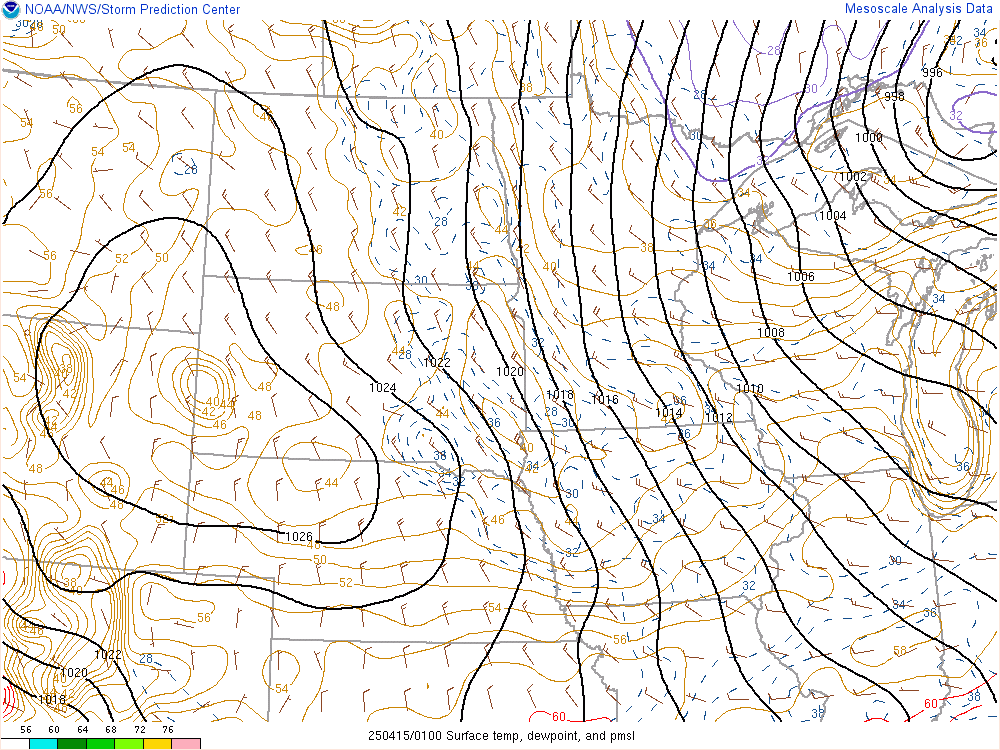
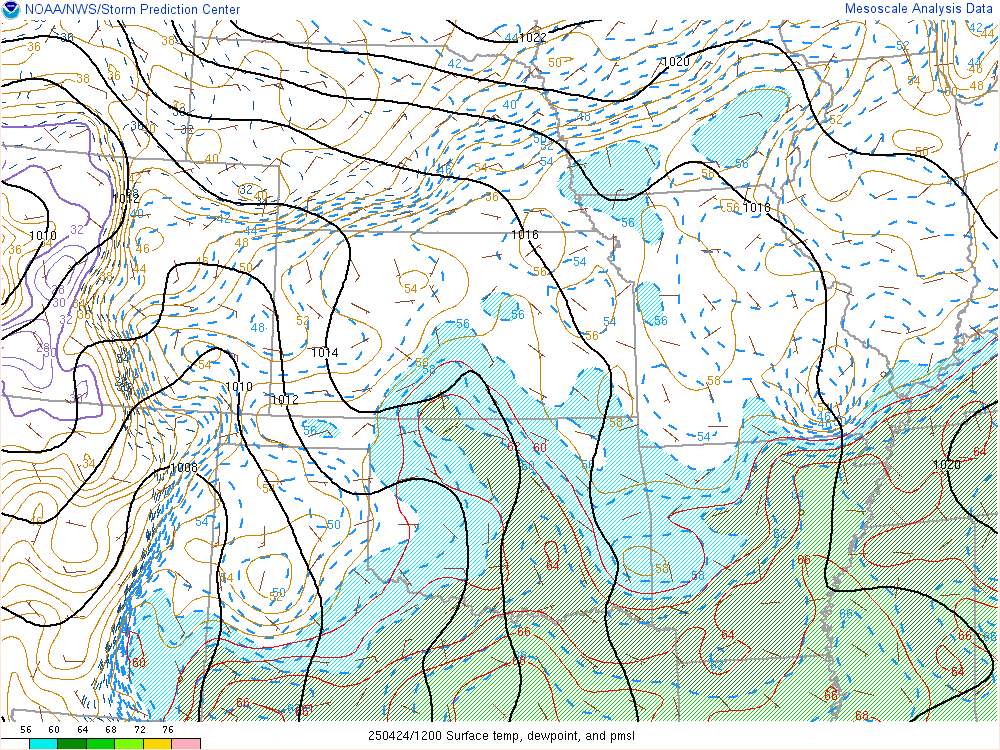
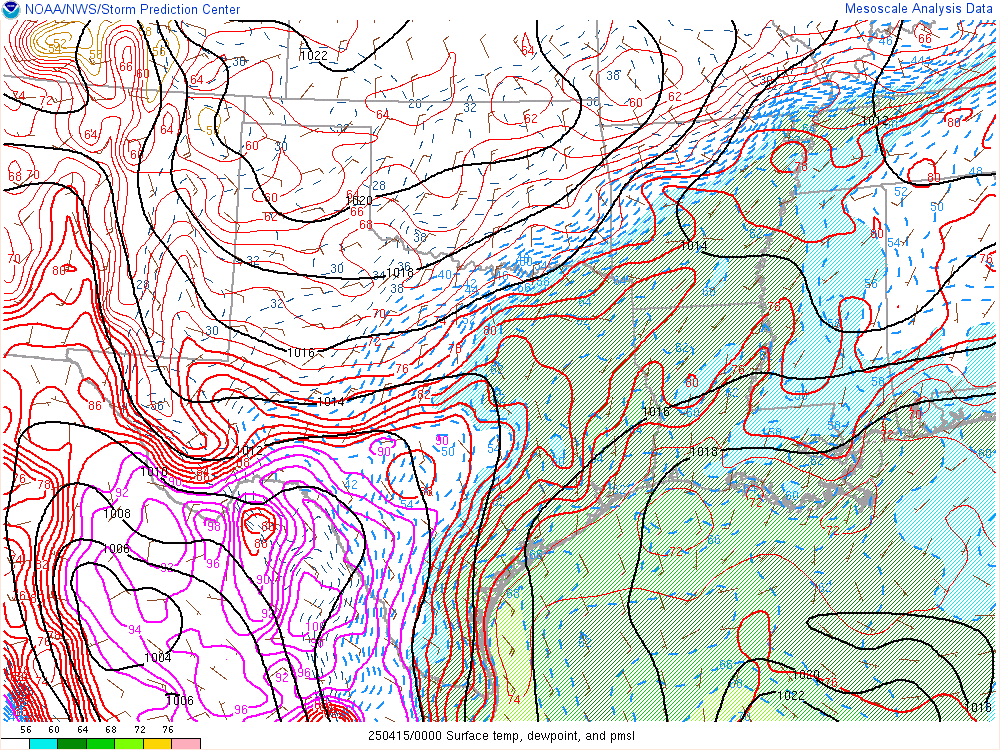
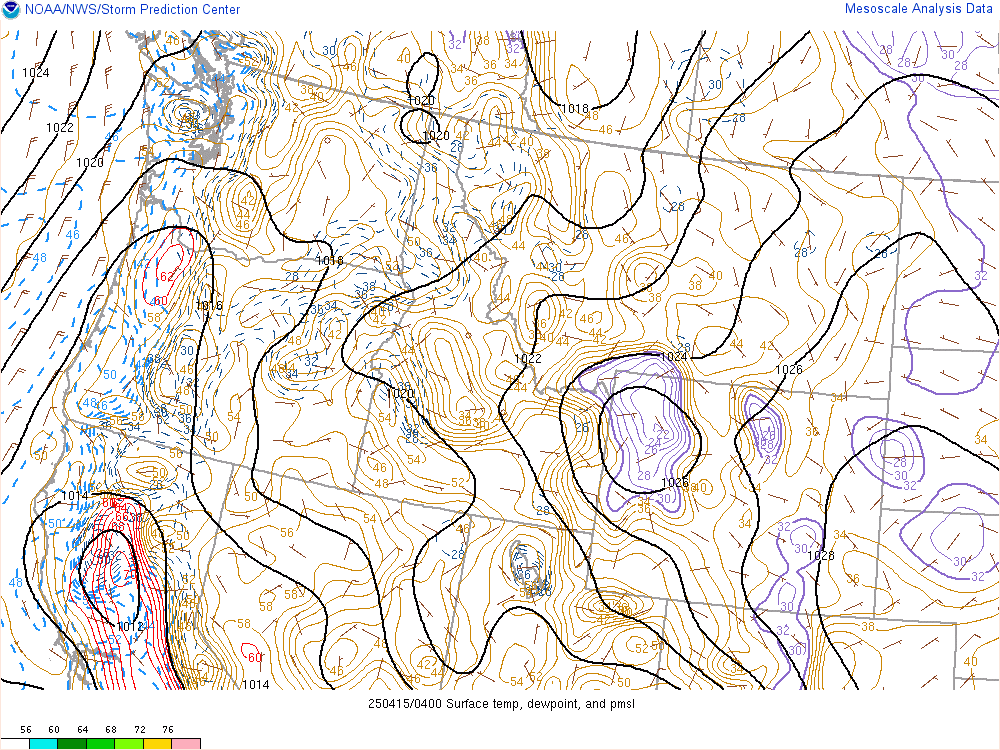
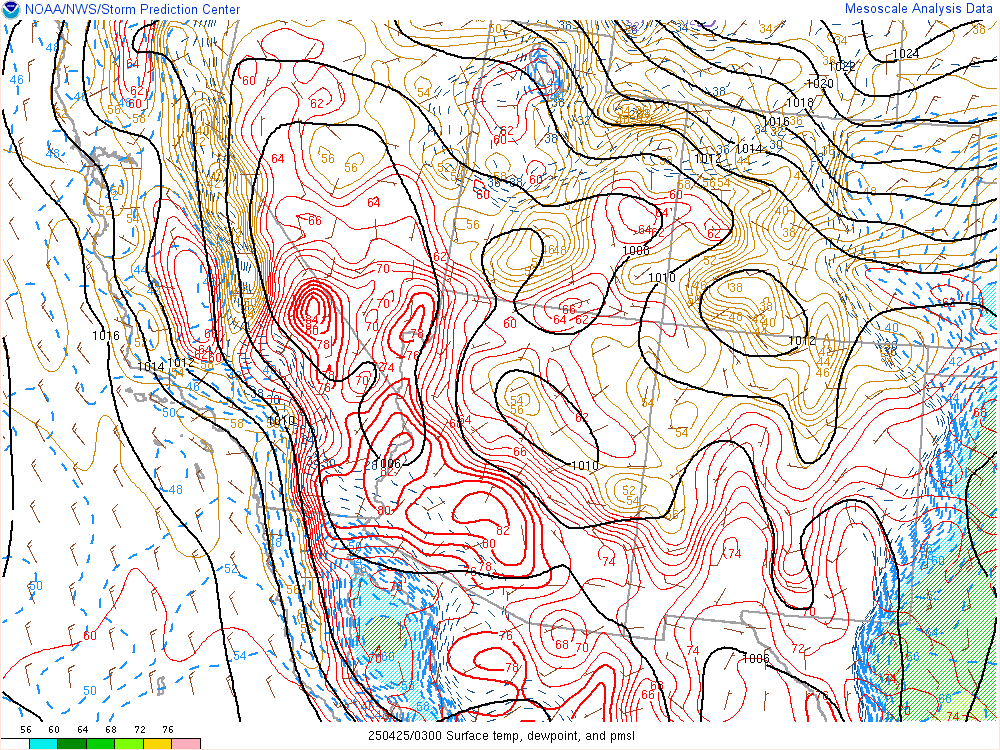
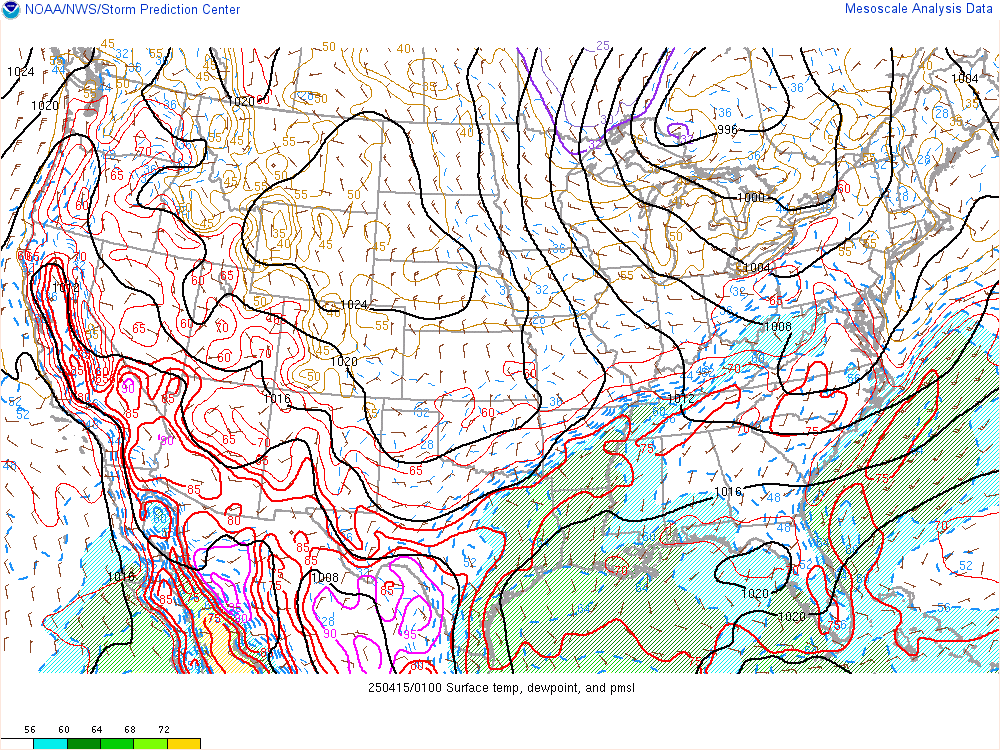
Current US Mesoscale Analysis:
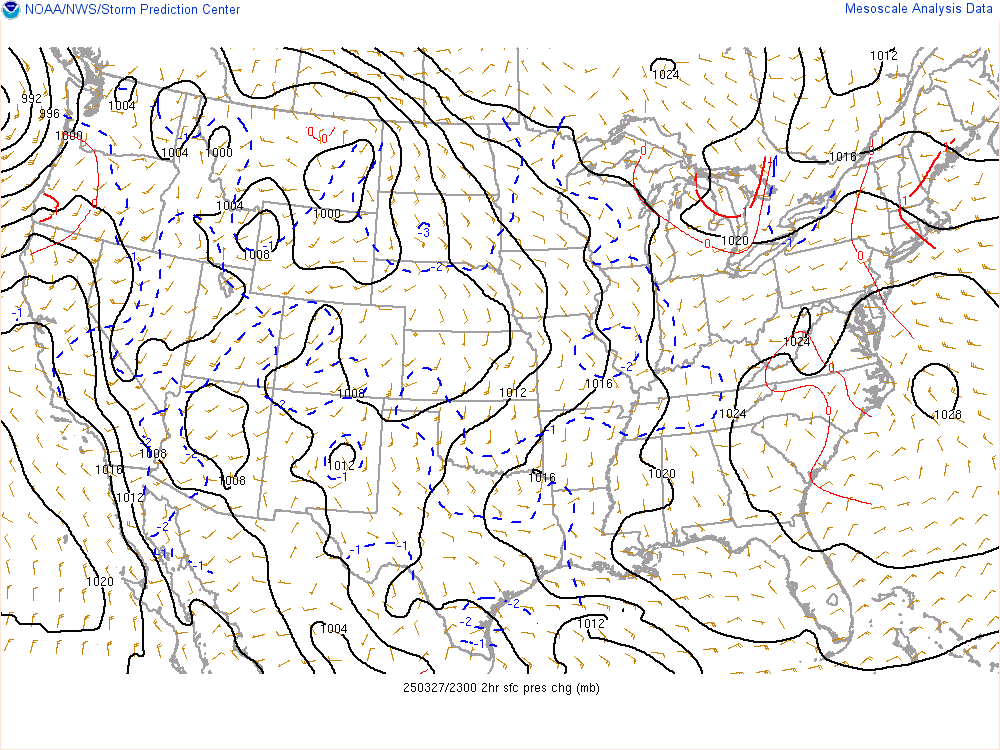
US 2 Hour Sea Level Pressure Change Chart:
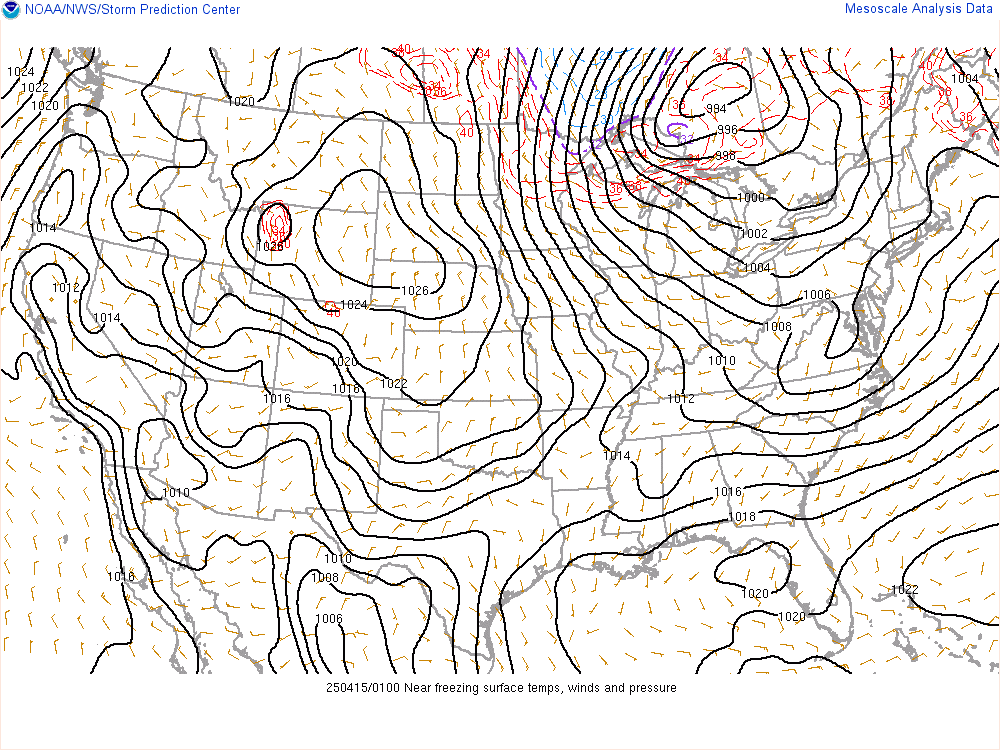
US Near Freezing Surface Temperatures:
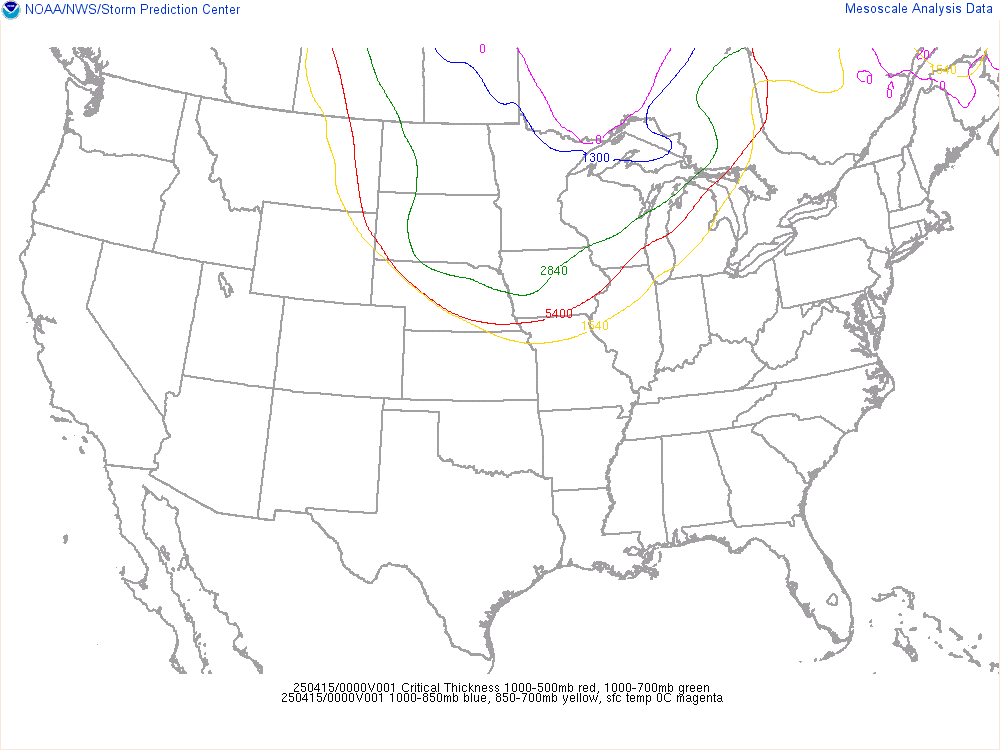
US Critical Thickness Analysis:
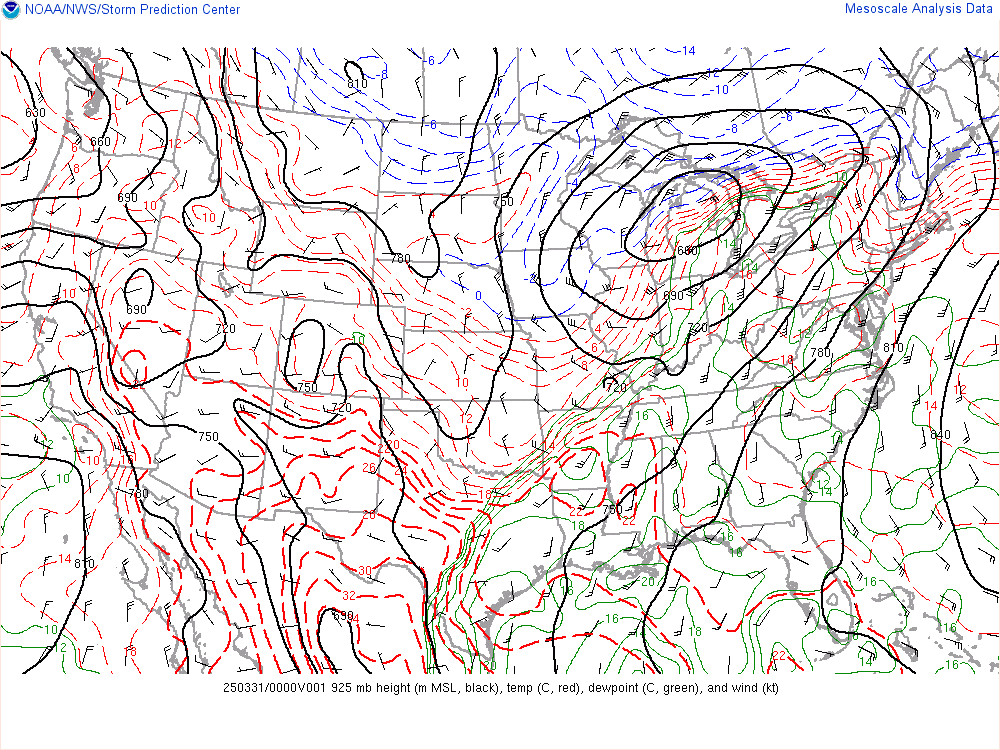
Current 925 Millibar Upper Air Chart:
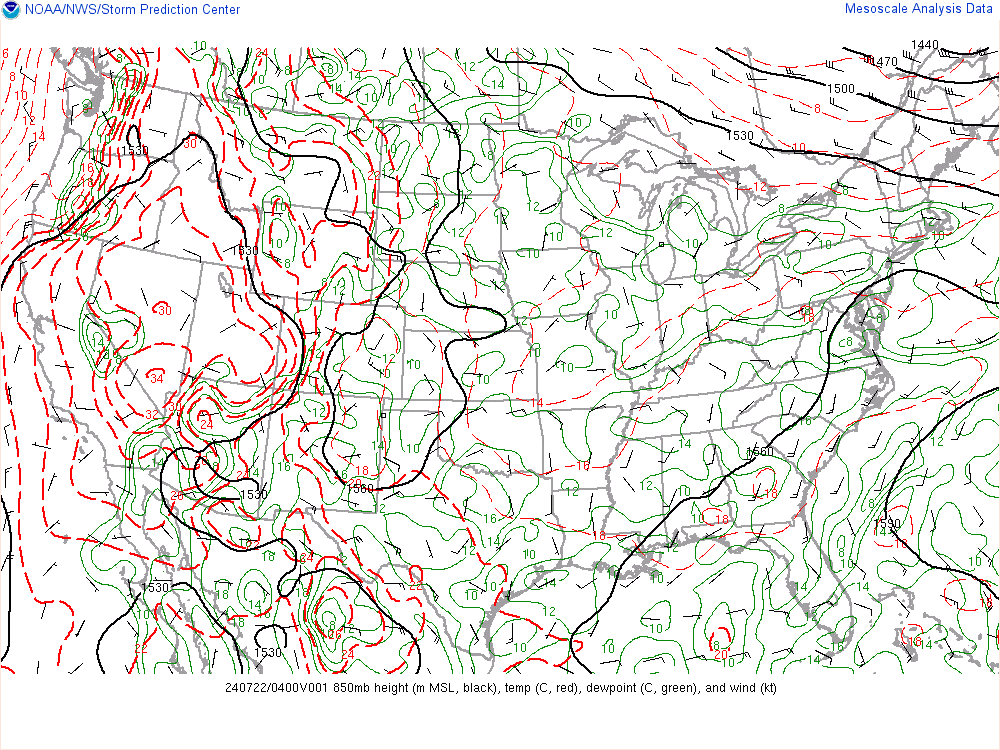
Current 850 Millibar Upper Air Chart:
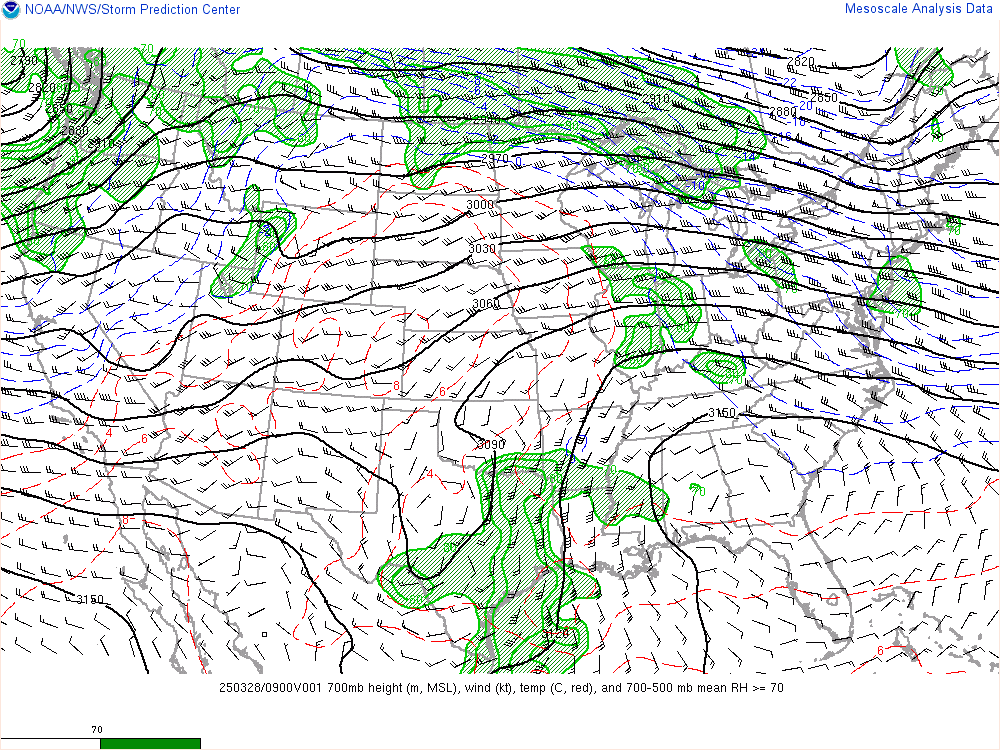
Current 700 Millibar Upper Air Chart:
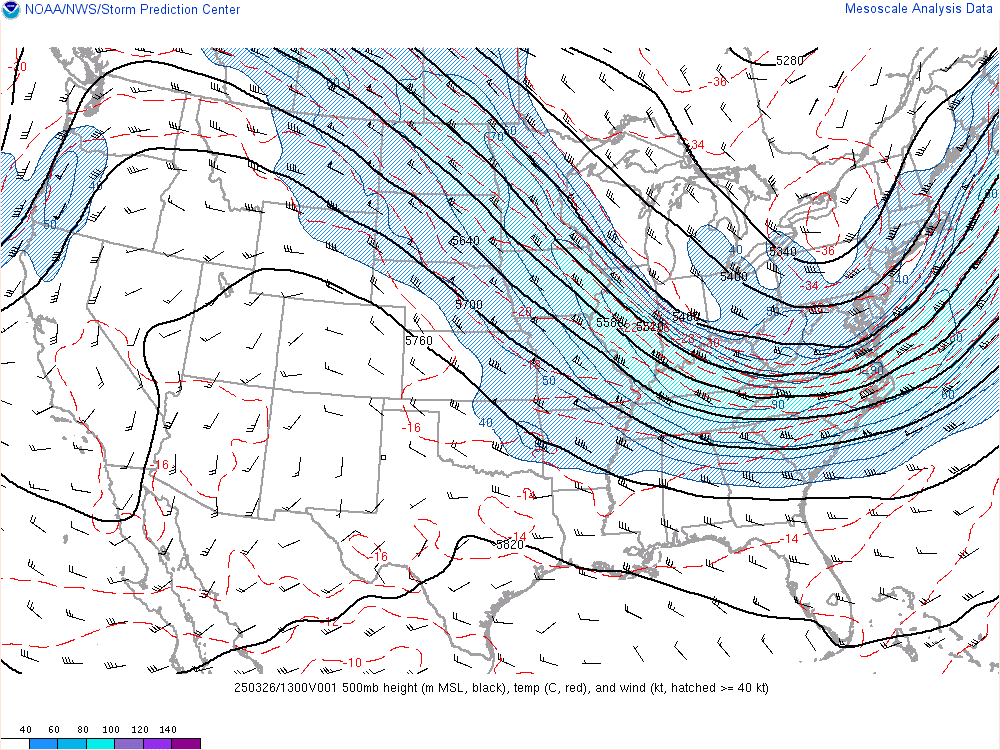
Current 500 Millibar Upper Air Chart:
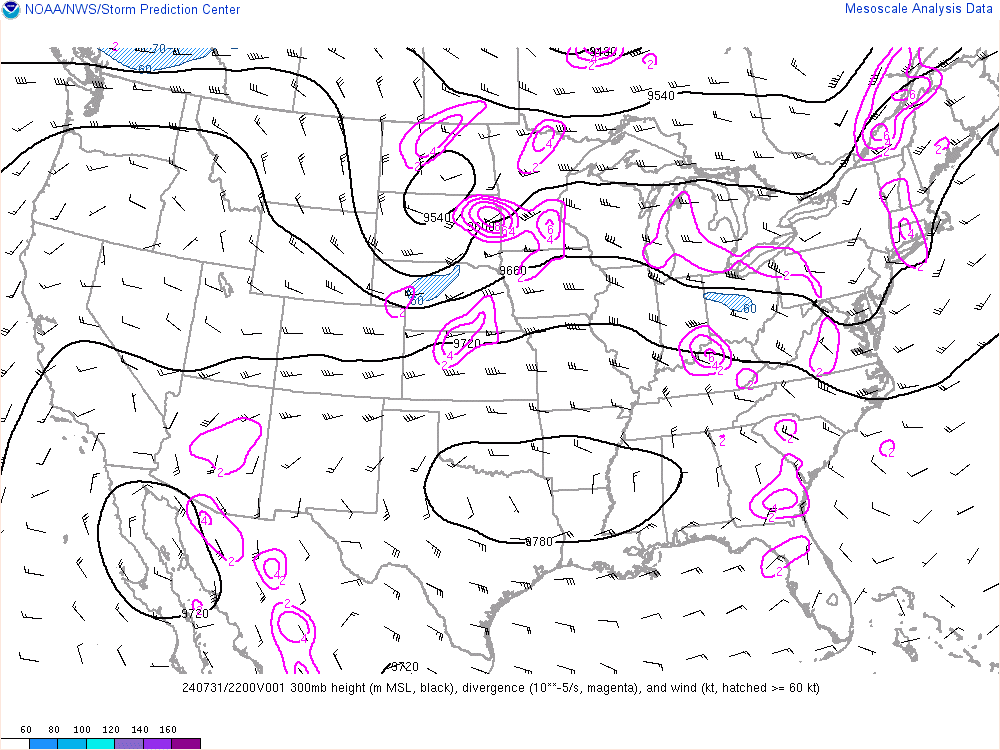
Current 300 Millibar Upper Air Chart:
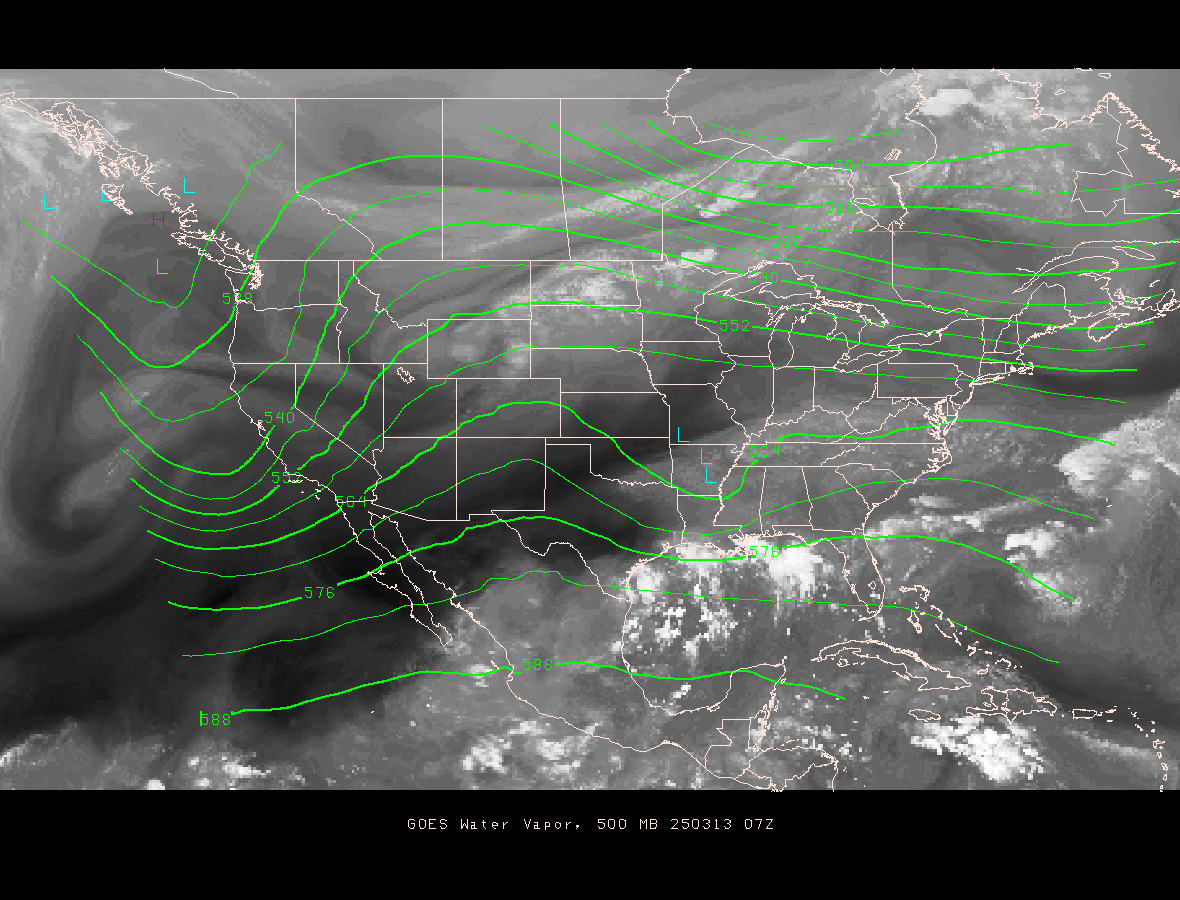
500 mb Upper Air Chart Overlayed On Water Vapor Satellite Image:
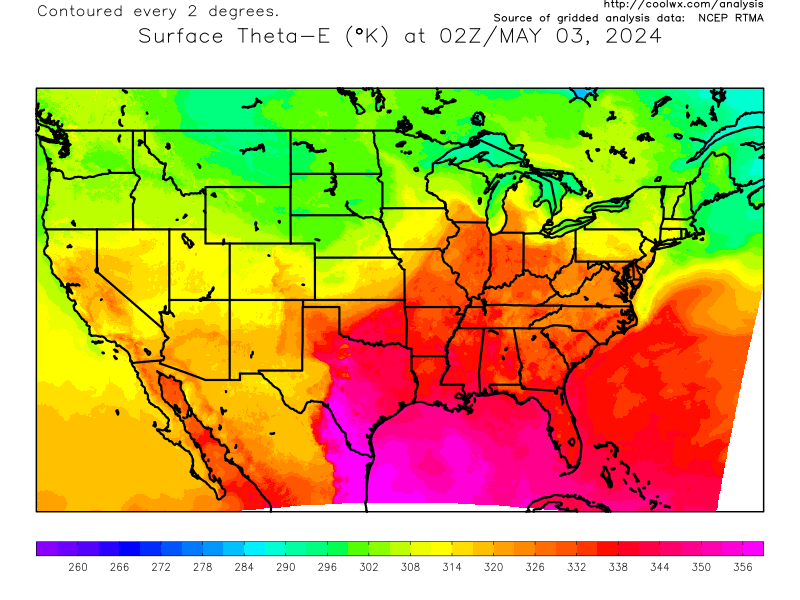
Current US Surface Theta-E Chart:
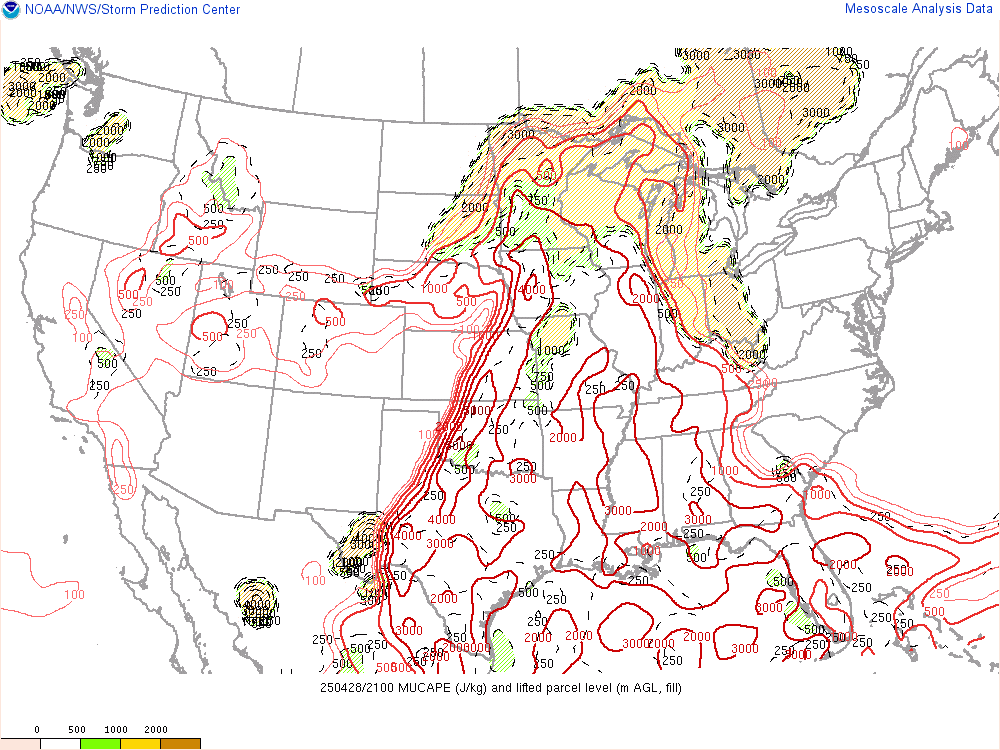
Current US CAPE Analysis:
Current US Storm Relative Helicity/Storm Motion Analysis:

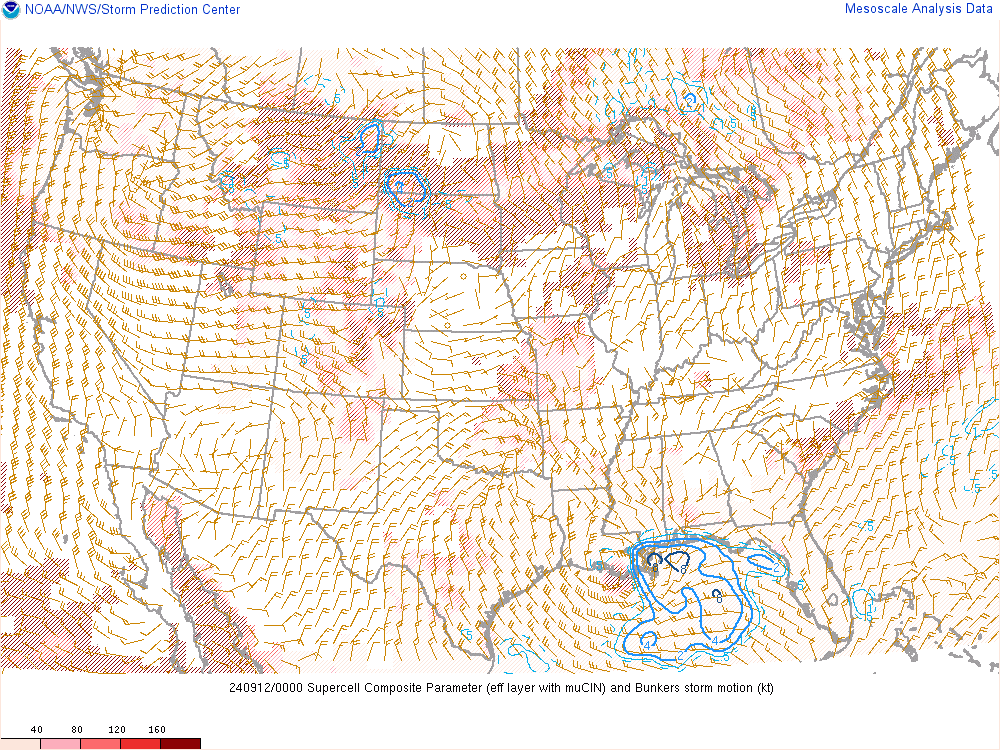
Current US Supercell Composite Analysis:
Current US Significant Tornado Parameter Analysis:

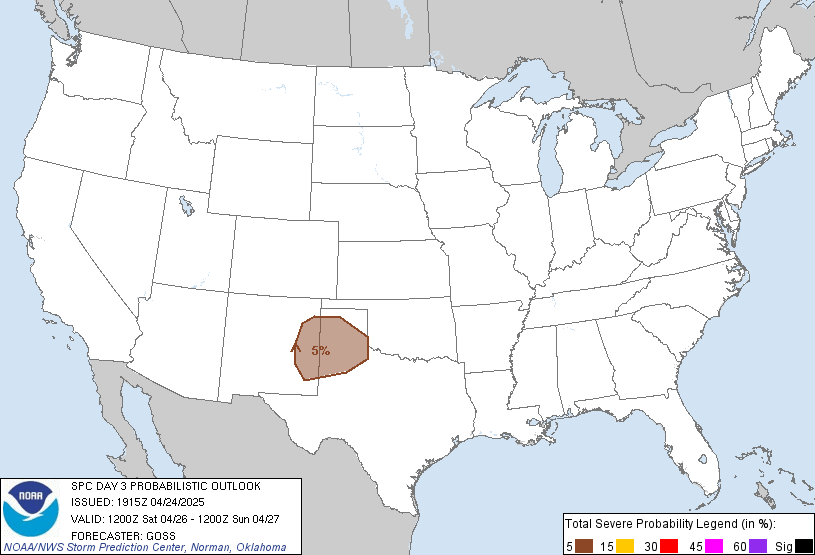
Probabilistic Outlook:
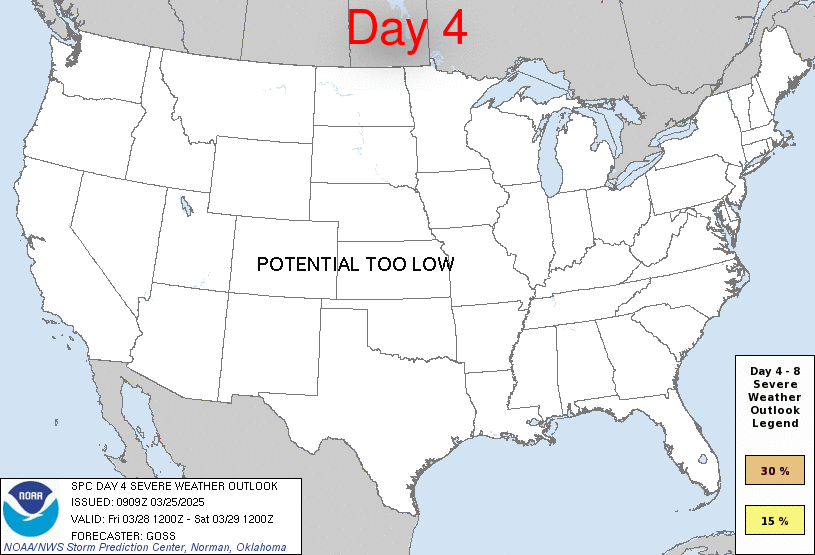
Day Four To Eight Severe Weather Outlook:
Other Severe Weather Products:
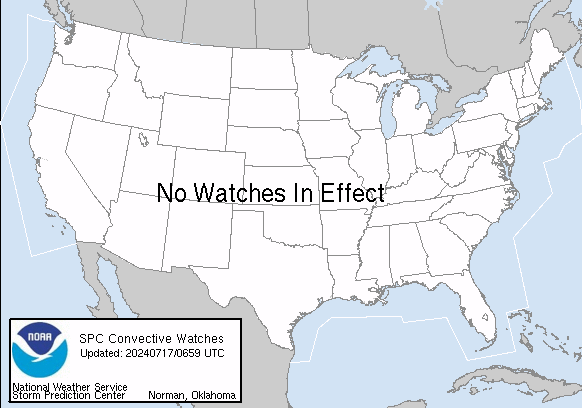
Current Severe Thunderstorm/Tornado Watches:
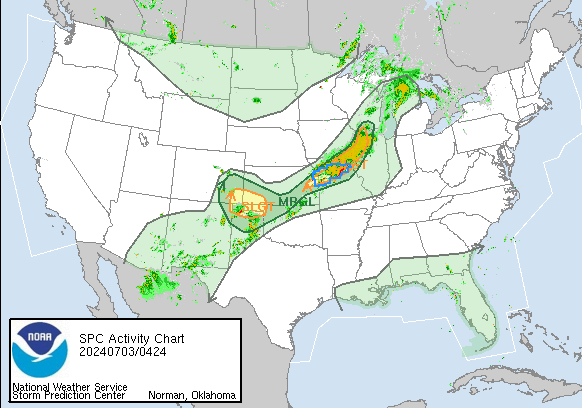
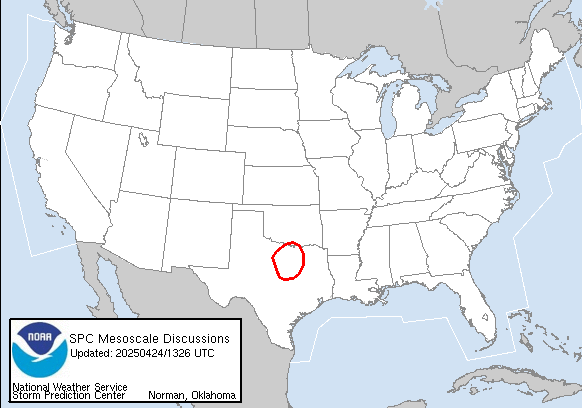
Current Mesoscale Discussions:
Storm Reports:
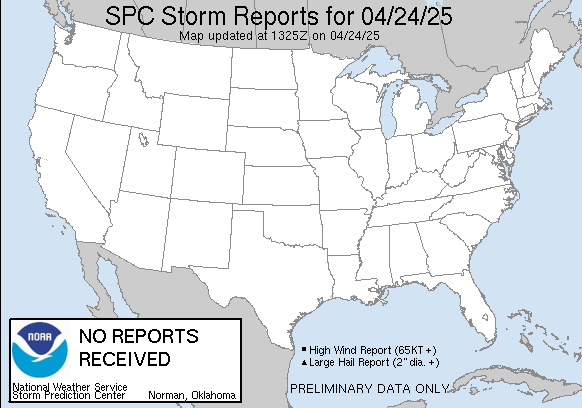
Today’s Storm Reports:
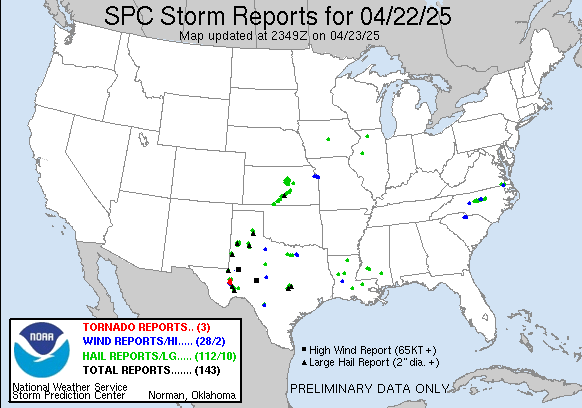
Yesterday’s Storm Reports:
Latest Quantitative Precipitation Forecast:
Day 1 Precipitation Forecast:

Day 2 Precipitation Forecast:

Day 3 Precipitation Forecast:

3 Day Precipitation Totals:

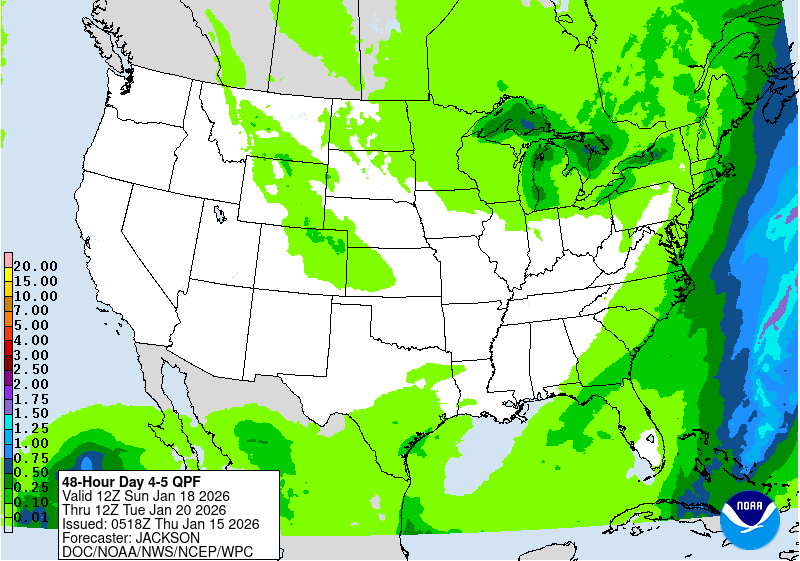
Days 4 and 5 Precipitation Forecast:
5 Day Precipitation Totals:

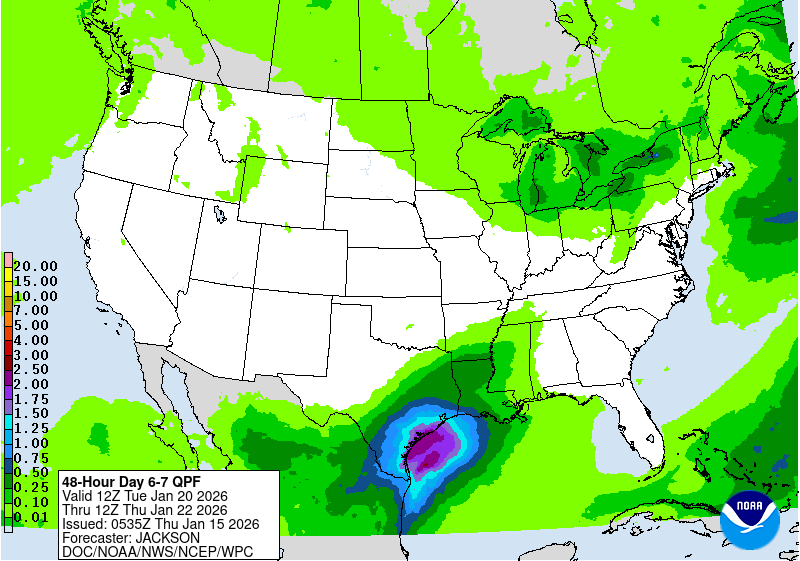
Days 6 and 7 Precipitation Forecast:
7 Day Precipitation Totals:

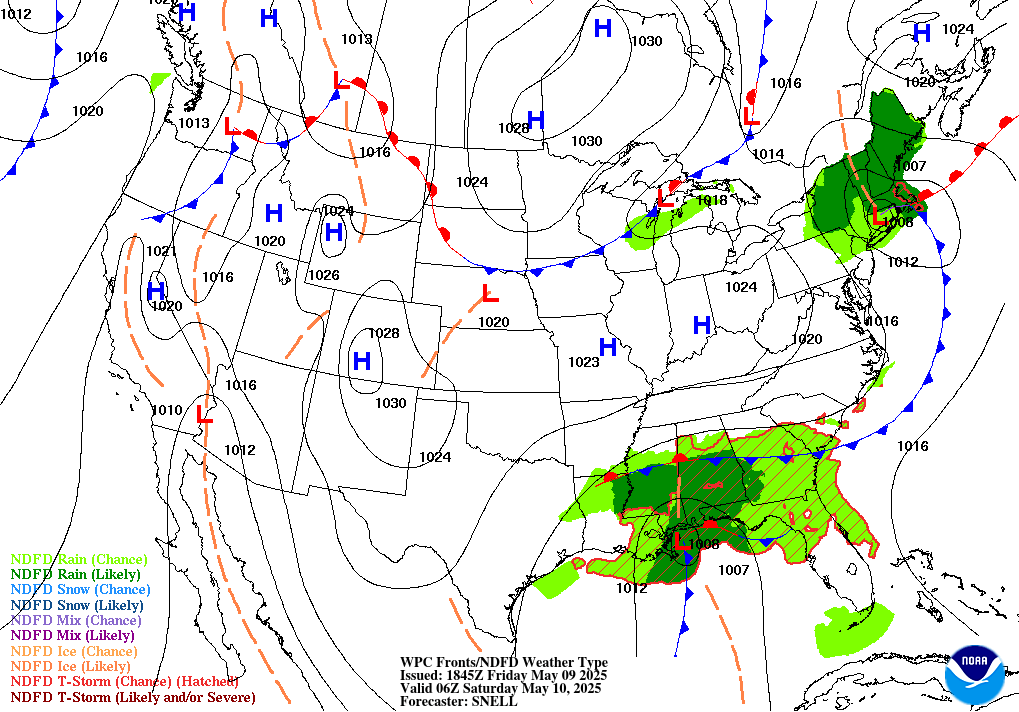
6 Hour Forecasted Surface Weather Map:
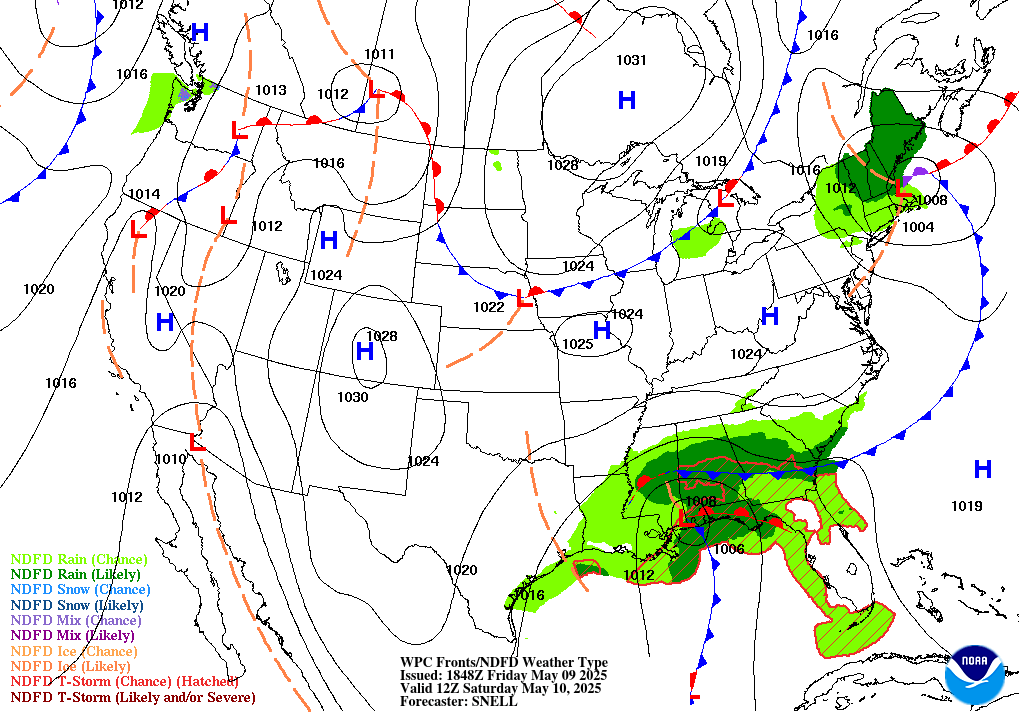
12 Hour Forecasted Surface Weather Map:
18 Hour Forecasted Surface Weather Map:
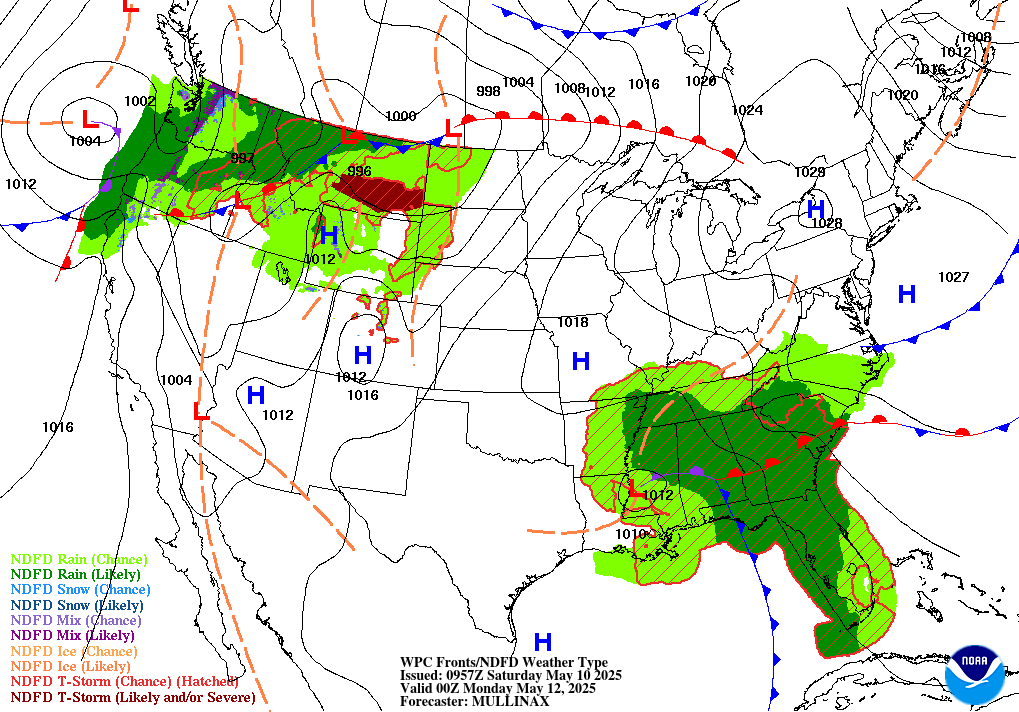
24 Hour Forecasted Surface Weather Map:
30 Hour Forecasted Surface Weather Map:
36 Hour Forecasted Surface Weather Map:
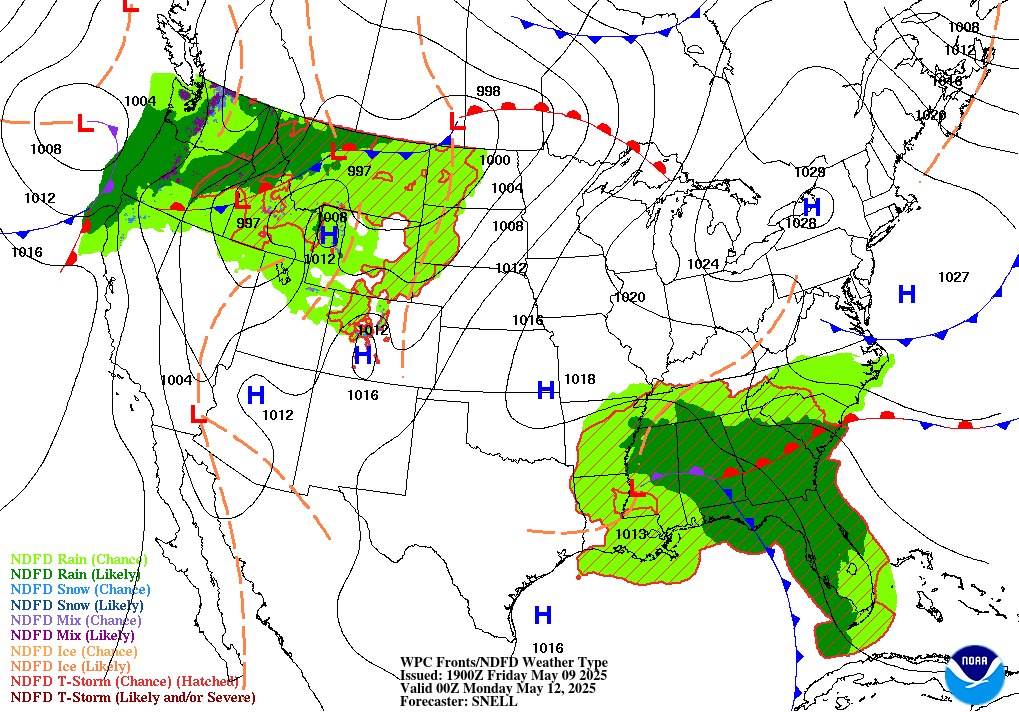
48 Hour Forecasted Surface Weather Map:
60 Hour Forecasted Surface Weather Map:
Day 3 to Day 7 Forecast Surface Weather Map:
