
TRACKING THE TROPICS
2 Day Tropical Weather Outlook
Current Tropical Surface Analysis Maps
Tropical Atlantic Southwest Atlantic

Gulf of America Caribbean
Current Sea Surface Temperatures

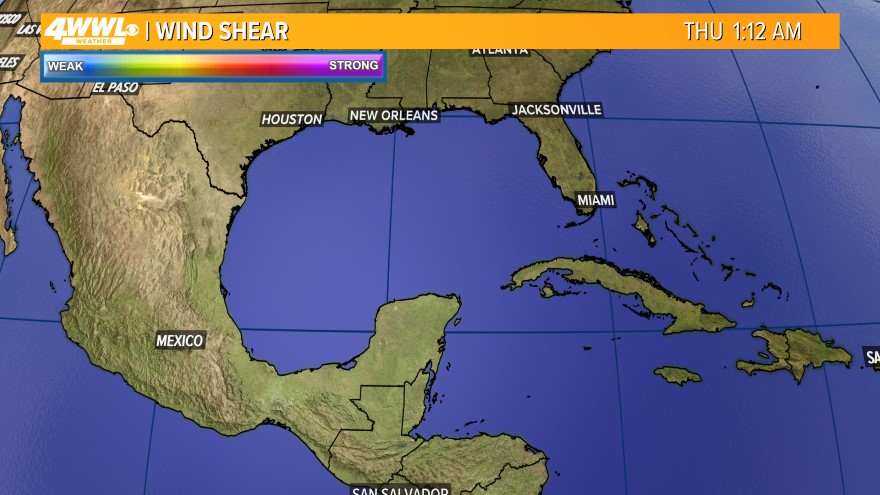
Current Wind Shear
Shear Tendency Past 24 Hours
Typical Tropical Cyclone Origins and Tracks by Month
June
July
August
September
October
November
June
 July
July August
 September
 October
 November
Hurricane Strike Percentages
Estimated return period in years for hurricanes passing within 50 nautical miles of various locations on the U.S. Coast
Central Gulf Coast Radar Loop Eastern Gulf Coast Radar East Coast Radar Northeast Coast Radar
![[Map of return period in years for hurricanes passing within 50 nautical miles]](http://www.nhc.noaa.gov/climo/images/return_hurr.jpg)
Estimated return period in years for hurricanes passing within 50 nautical miles of various locations on the U.S. Coast
![[Map of return period in years for major hurricanes passing within 50 nautical miles]](http://www.nhc.noaa.gov/climo/images/return_mjrhurr.jpg)
 Central Gulf Coast Radar Loop
 Eastern Gulf Coast Radar
 East Coast Radar
 Northeast Coast Radar


Current Vorticity
850mb
700mb
850mb
700mb
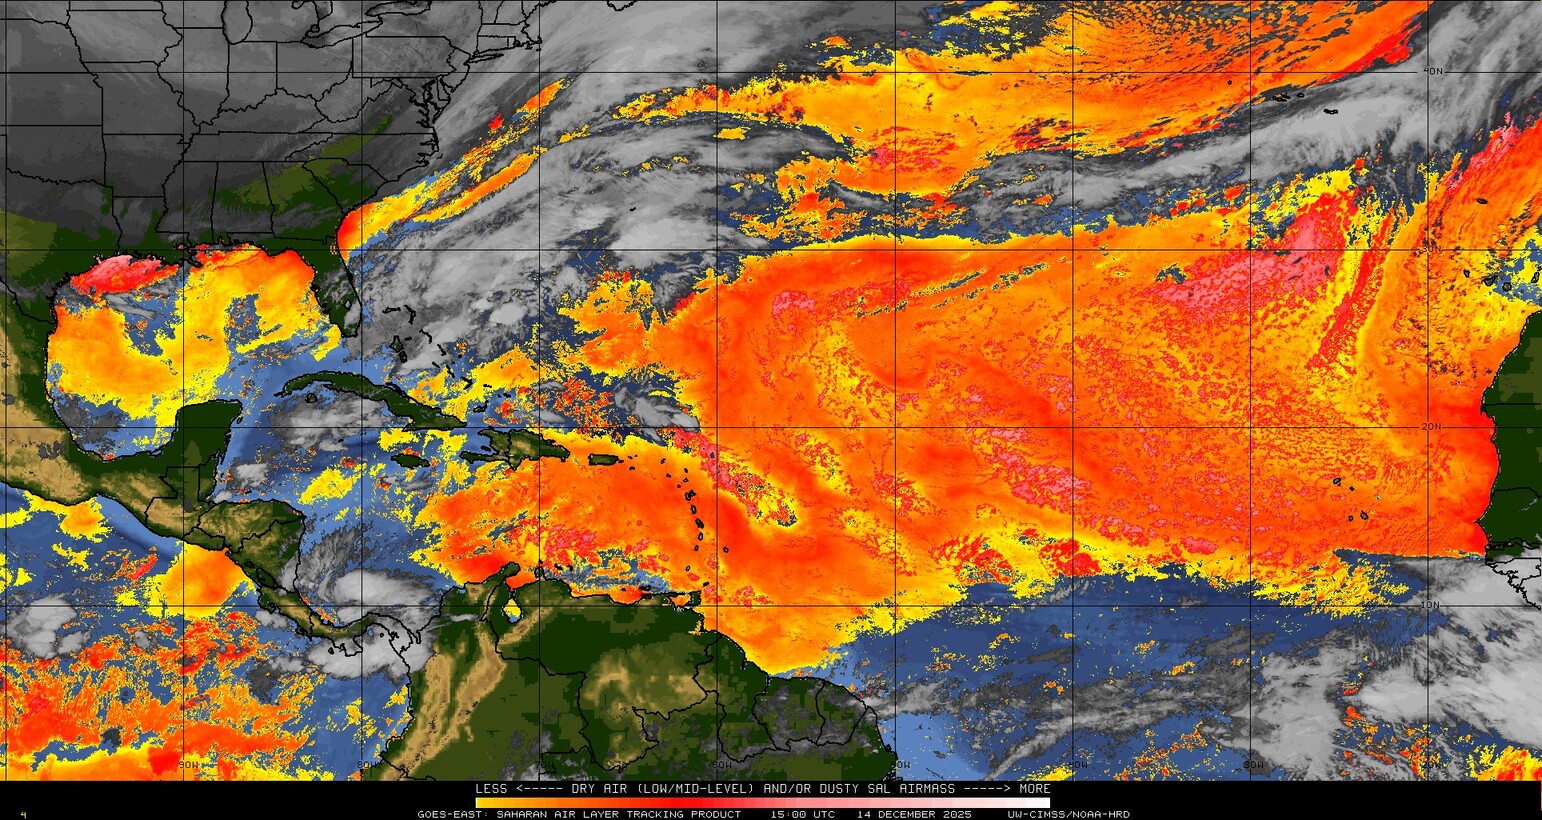
Saharan Air Layer (Dry Air)
Current Wind / Wave Analysis
Current Wind Direction
Lower Level Winds
Upper Level Winds
Lower Level Winds
 Upper Level Winds
Current Wind Steering
200-700mb
700-850mb
200-700mb
 700-850mb
Atlantic Sea Height / Waves

 Other Analysis Graphics
Weather Forecasts
3 Day Loop Current Day 1 (Today) Current Day 2 (Tomorrow) Current Day 3 Days 3 thru 7
3 Day Loop
 Current Day 1 (Today)
  Current Day 2 (Tomorrow)
  Current Day 3
 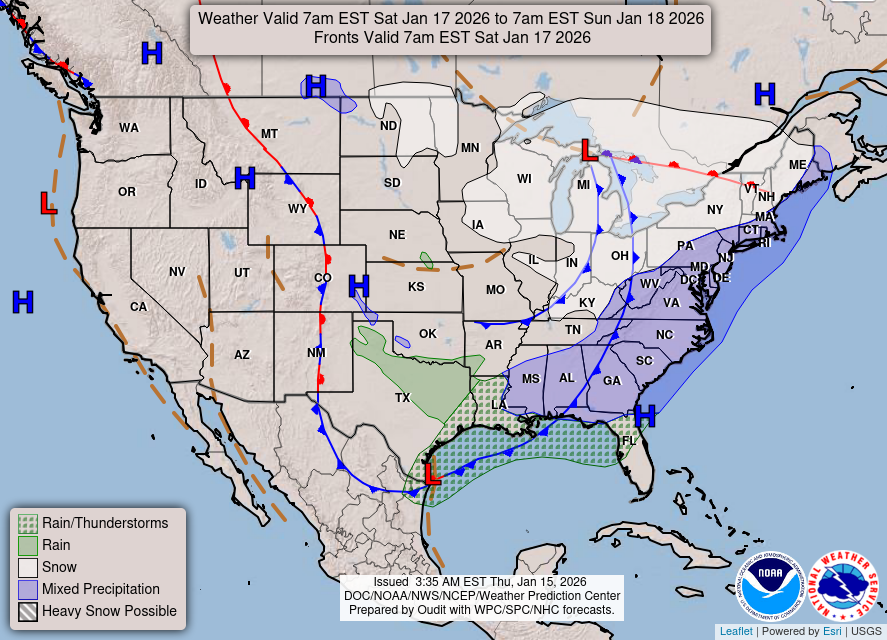 Days 3 thru 7
Future Surface Analysis Forecasts
24 Hour NHC Forecast48 Hour NHC Forecast 72 Hour NHC Forecast
24 Hour NHC Forecast
 48 Hour NHC Forecast
  72 Hour NHC Forecast
MJO Model Forecasts
40 Day Forecast
GEOColor IR
Infrared
Total Precipitable Water
40 Day Forecast
GEOColor IR


Infrared
 Total Precipitable Water