This is a look at the severe weather threat for the next 8 days.
0 – 24 Hours


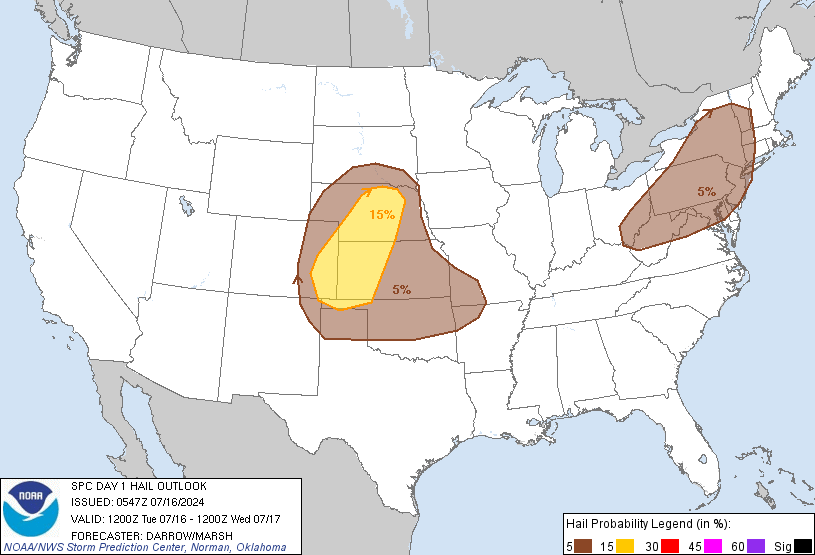
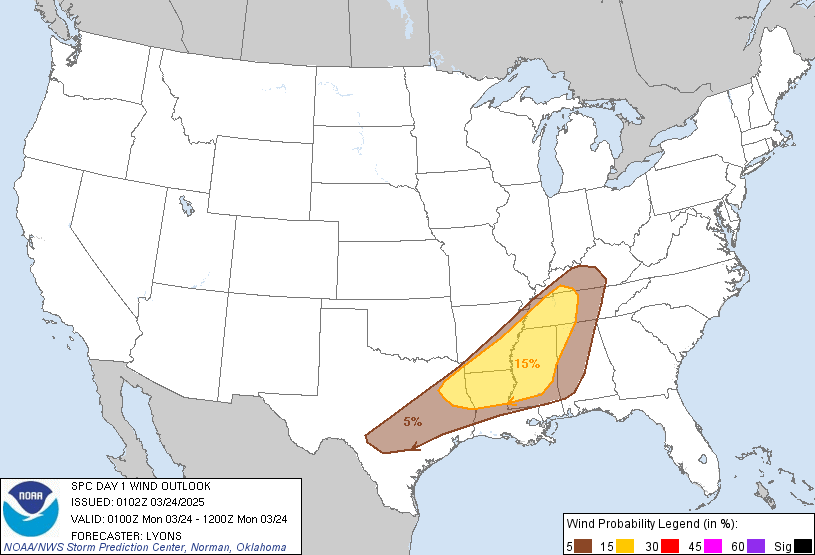
Current discussion from the Storm Prediction Center:
24 – 48 hours
48 – 72 Hours
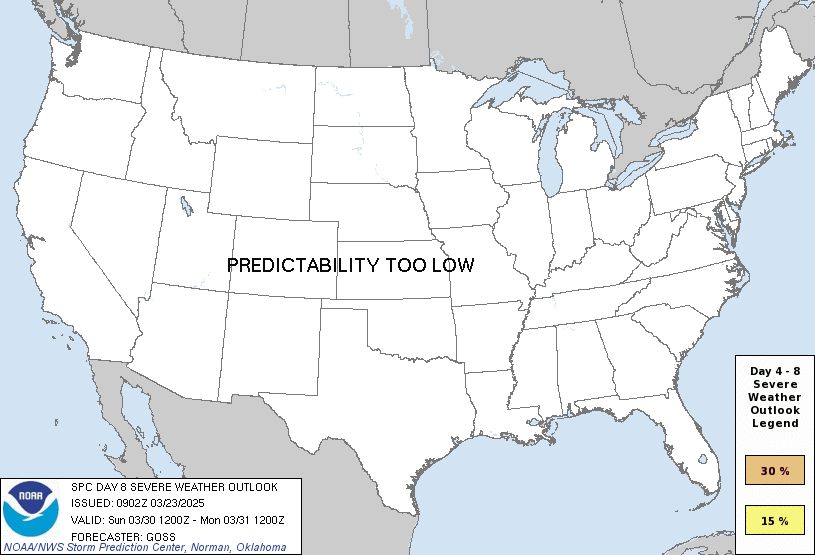
Day 4 – 8
Reading this page…
FROM THE SPC:
Convective Outlook Issuance Times
Day 1 Convective Outlook – 0600Z, 1300Z, 1630Z, 2000Z, and 0100Z
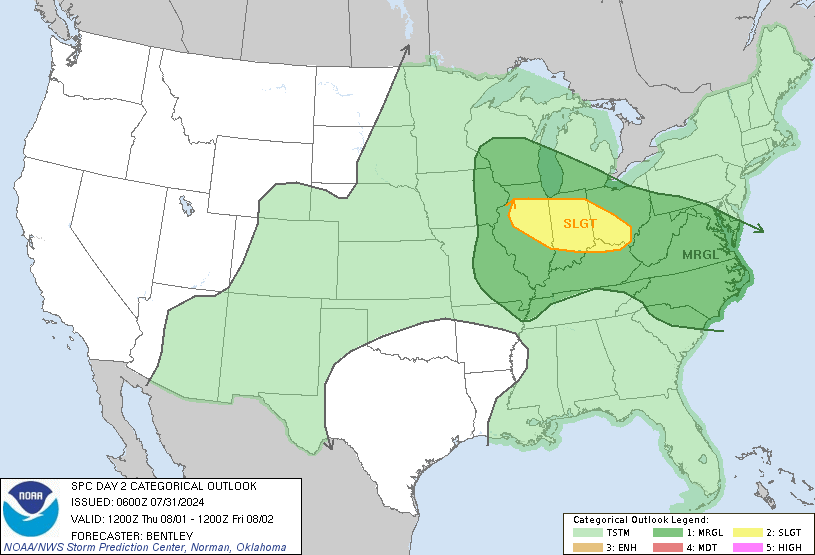
Day 2 Convective Outlook – 100 AM (CST and CDT) and 1730Z
Day 3 Convective Outlook – 230 AM (CST and CDT)
Day 4-8 Severe Weather Outlook – 400 AM (CST and CDT)Each Day 1 Convective Outlook is valid from the start of issuance (except for the 0600 UTC issuance which begins at 1200 UTC that day) through 1200 UTC the following day (except for the 0100 UTC issuance which is valid through that day).
Each Day 2 Convective Outlook covers the period from 1200 UTC the following day to 1200 UTC the day after that. For example, if today is Monday, then the Day 2 Convective Outlook will cover the period of 1200 UTC Tuesday to 1200 UTC Wednesday.
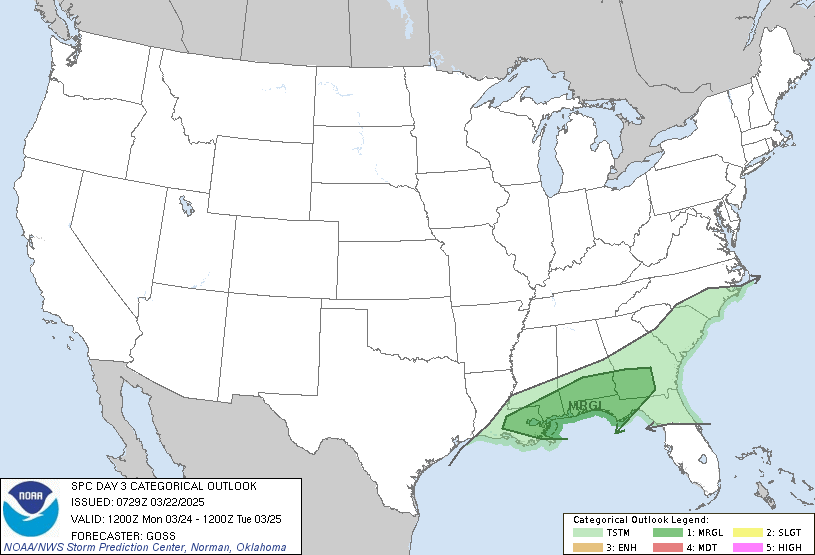
The Day 3 Convective Outlook covers the period of 48 to 72 hours from 1200 UTC on the morning of product issuance.
The Day 4-8 Severe Weather Outlook covers the period of 72 to 192 hours from 1200 UTC on the morning of product issuance.This link describes the meaning of “Z” in our product issuance and valid times.
Day 4-8 Severe Weather Outlook
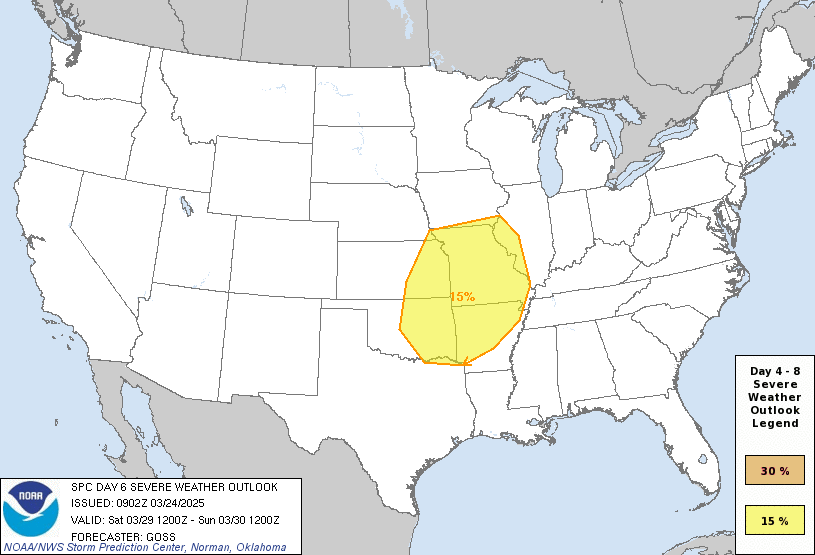
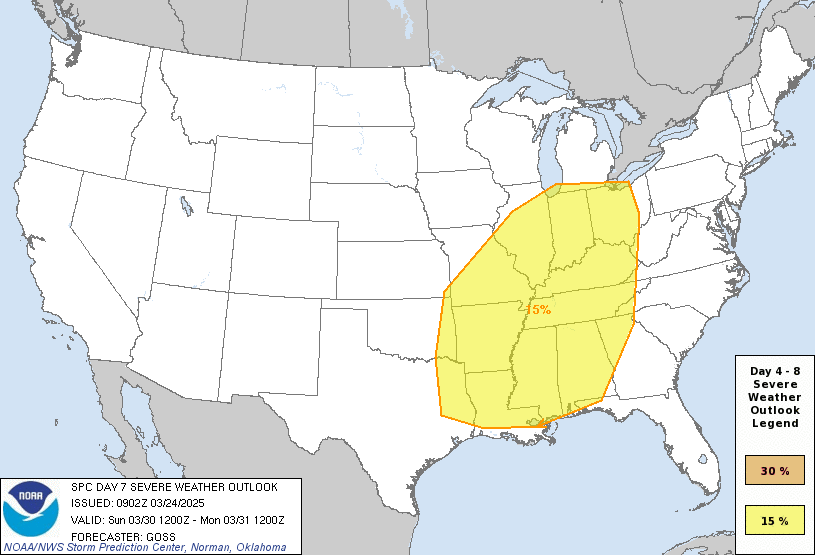
Two probabilistic thresholds of 15% and 30% can be forecast. Highlighted areas are equivalent to 2-SLGT-yellow or 3-ENH-orange risks on the Day 1-3 Convective Outlooks. On rare occasions, the outlook text will begin with a headline for the possibility of a severe weather outbreak.
If no 15% areas are forecast, one of the following phrases will be used:
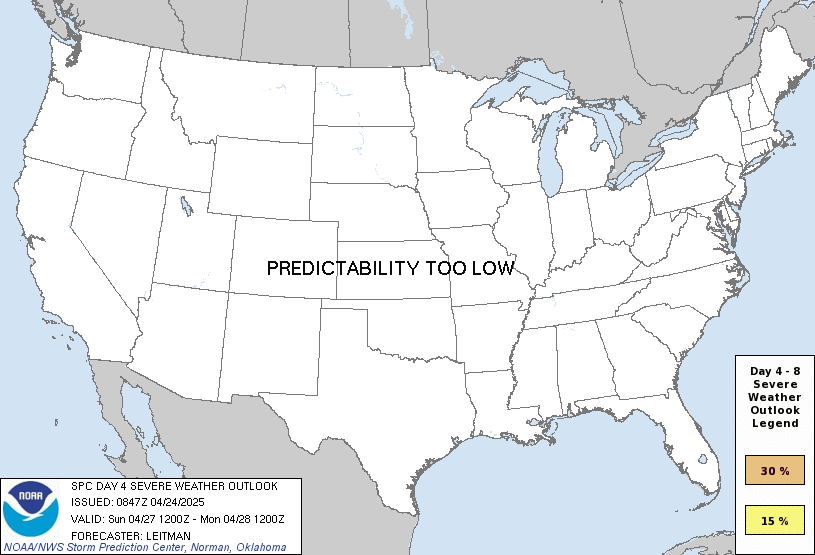
PREDICTABILITY TOO LOW: Used to indicate severe storms may be possible based on some model scenarios. However, the location or occurrence of severe storms is in doubt due to large spread in model guidance and/or minimal run-to-run continuity.
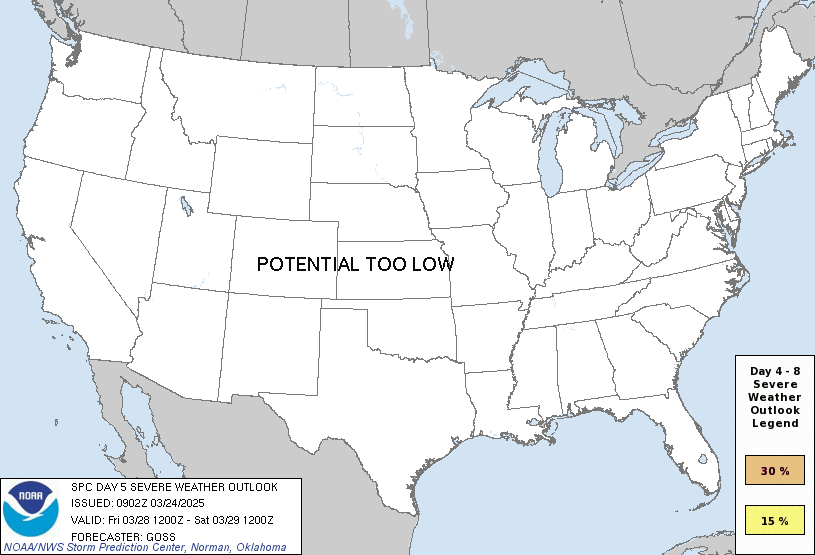
POTENTIAL TOO LOW: Used to indicate that 15% or greater severe probabilities appear highly unlikely on that day.
Using the Convective OutlooksForecasting rare events such as tornadoes and the occurrence of large hail and damaging wind gusts is a difficult process and one that contains a large amount of uncertainty. It is important not to rigidly associate the type of risk area (e.g., 2-SLGT-yellow) with the severe potential for any given thunderstorm in the risk area. That is, just because a 2-SLGT-yellow risk is forecast does not necessarily mean that the thunderstorms within the risk area will be slightly severe. Sometimes, violent tornadoes occur in 2-SLGT-yellow, 3-ENH-orange, or 4-MDT-red risk areas as opposed to 5-HIGH-magenta. The reason for this is the synoptic situation producing the violent tornadoes may be confined to a relatively small area or a conditional, uncertain situation. Another 2-SLGT-yellow risk area may cover several states in which only one or two tornadoes are expected to develop. Some 2-SLGT-yellow situations won’t involve a threat of tornadoes or supercells, but sustained multicell storms with a threat for severe hail and wind damage.
SPC severe weather outlooks forecast events from organized convection (e.g., supercells, squall lines, and multicell thunderstorm complexes), most capable of damage and injury from tornadoes, damaging winds, or large hail. Pulse-type thunderstorms, consisting primarily of solitary brief severe updrafts (often found in environments with weak vertical wind shear) are not considered organized. Convection of this type, may not be included in a risk area, unless forecaster confidence is high enough to draw a 1-MRGL-dark green risk. Since almost any thunderstorm can produce a brief severe weather event, it doesn’t necessarily mean there is a conflict when a severe thunderstorm warning is issued by a local NWS office outside of an SPC severe weather risk area.
In short, no two situations are alike, even within the same risk category. This is why a probabilistic forecast and text discussion accompanies the categorical outlook. The probabilities used in the SPC Convective Outlooks are known as subjective probabilities. The forecaster makes their best estimate of the probability of an event occurring. The probabilities that you see on the graphics represent the probability of one or more events occurring within 25 miles of a point during the outlook period. This definition is used as the probability of severe weather at a given point is quite small. How many times have you experienced a tornado in your neighborhood? For most people, the answer is never. Now think of how many times severe weather has occurred within 25 miles of your location. It’s probably safe to say that you can think of some close-by severe weather events. You should be able to imagine that the probability of having severe weather occur within such an area is much larger than the probability of having it occur specifically within any one neighborhood.
How should you interpret probabilistic values? The smallest values represent areas where the most uncertainty exists and correspondingly where the smallest expected coverage of storm reports exists. The higher the probabilities, the greater the perceived threat, and the greater the expected coverage of that hazard being forecast. The highest probabilities are generally reserved for more significant severe weather events and are used infrequently, if at all, during the year. Another way of thinking of the values is related to climatology. For example, let’s assume that the SPC forecaster drew a 30% area for tornadoes which included northwest Texas and southwestern Oklahoma in mid-May. The ratio of the forecast to climatology (30%/1.5%) yields a value of approximately 20. The SPC forecaster is stating they believe the risk of tornadoes in that region is 20 times larger than climatology. By comparing the forecast probability to climatology, you can better determine the magnitude of the risk on a given day. See the SPC Severe Weather Climatology page to find climatological values for where you live.
The most specific Convective Outlooks are those issued during the Day 1 period. Accordingly, SPC forecasters have the most information available to them to differentiate the threats of the individual severe weather hazards. During this period, the SPC produces probabilistic outlooks for each primary severe weather hazard (tornadoes, damaging wind, and large hail) separately. By producing separate forecasts for tornadoes, damaging wind, and large hail, the user is given substantially more information upon which to make decisions than in the categorical outlook. Users who are sensitive to one particular threat (e.g., car dealers and large hail) can make more informed decisions.
Since many of the specific details of severe weather forecasting can only be determined hours ahead of time, rather than several days, the severe weather probabilities for the Day 2 and Day 3 Convective Outlooks represent the probability of any severe weather hazard (large hail, damaging wind, or tornadoes) occurring. In addition, for tropical cyclones (hurricanes, tropical storms, or depressions), the outlooks on Day 2 and Day 3 allow a 5% total severe probability to be a SLGT risk because they are specifically tornado-driven.

