

- Sun. Feb 1st, 2026
Latest Post
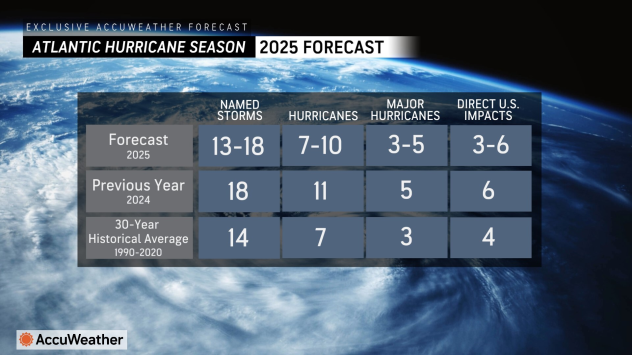 The 2025 hurricane season expected to be slightly above average!
 Camp Mystic Devastating Flooding, what can we learn from it?
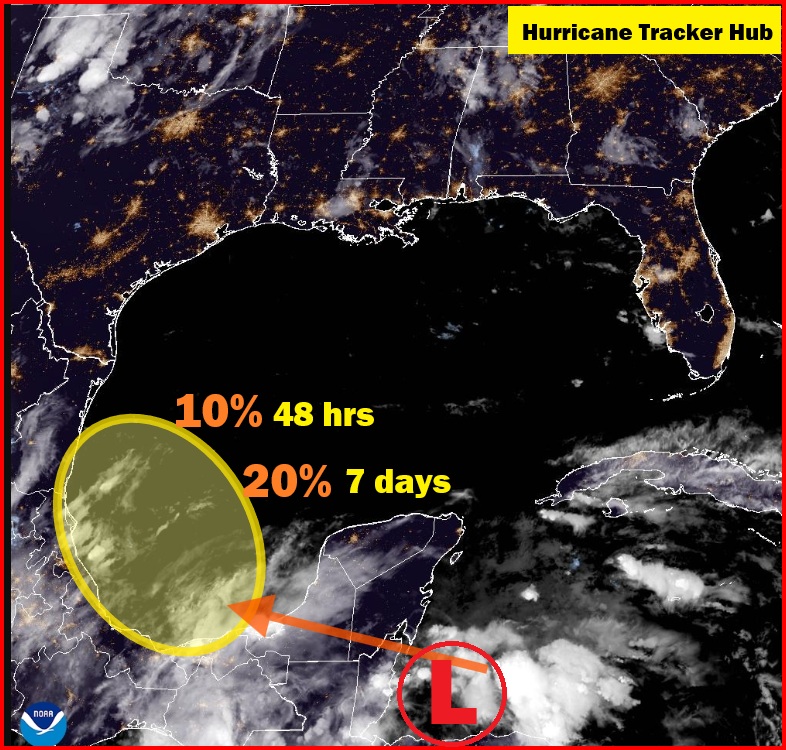 Tropical System in the Southwestern Gulf of America: An Evening Update from the National Hurricane Center
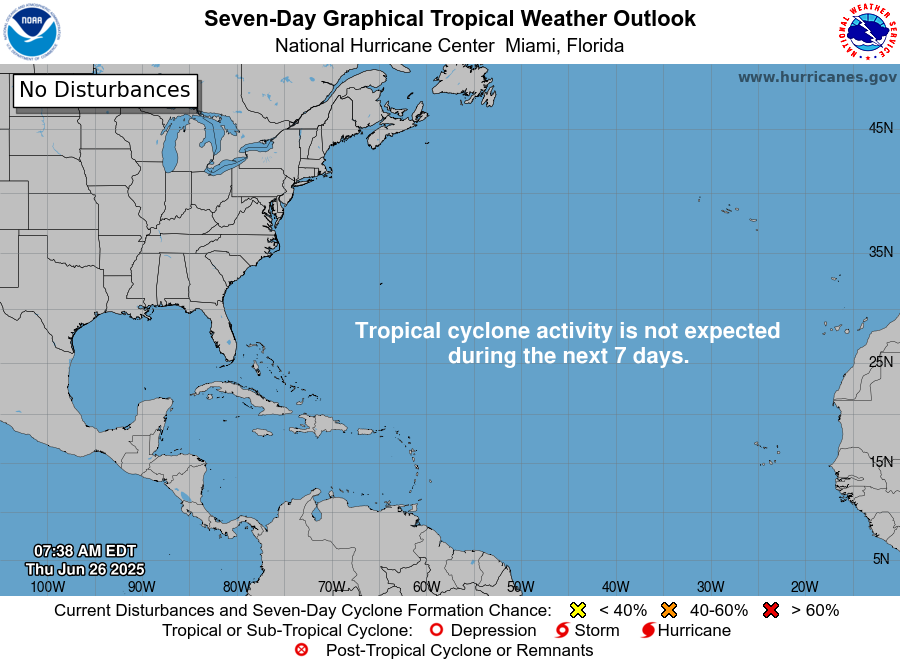 National Hurricane Center Tropical Outlook for June 26, 2025: Gulf of Mexico and Atlantic Region
NHC Tropical Update for June 26, 20252: What You Need to Know
National Hurricane Center Tropical Outlook for June 26, 2025: Gulf of Mexico and Atlantic Region
NHC Tropical Update for June 26, 20252: What You Need to Know
EXPERT HURRICANE TRACKING
Latest Tropical Weather Outlook:
Latest Tropical Weather Discussion:
hattiesburg bobby l chain municipal airport weather forecast
 Live satellite from F5Weather
 Live satellite from F5Weather
 Live radar from F5Weather
 Live radar from F5Weather
 Live radar from F5Weather
Current US Surface Weather Map
Western Atlantic Infrared Satellite Image:
Tropical Atlantic Wide Infrared Satellite Image:

Gulf Of Mexico Infrared Satellite Image:

US East Coast Infrared Satellite Image:

Tropical Atlantic Wide Visible Satellite Image:

Gulf Of Mexico Visible Satellite Image:

Western Atlantic Water Vapor Satellite Image:
Tropical Atlantic Wide Water Vapor Satellite Image:

Gulf Of Mexico Water Vapor Satellite Image:

Caribbean Water Vapor Satellite Image:

Eastern Atlantic Infrared Satellite Image:
Eastern Atlantic Infrared Satellite Image:

Eastern Atlantic Visible Satellite Image:

Eastern Atlantic Water Vapor Satellite Image:

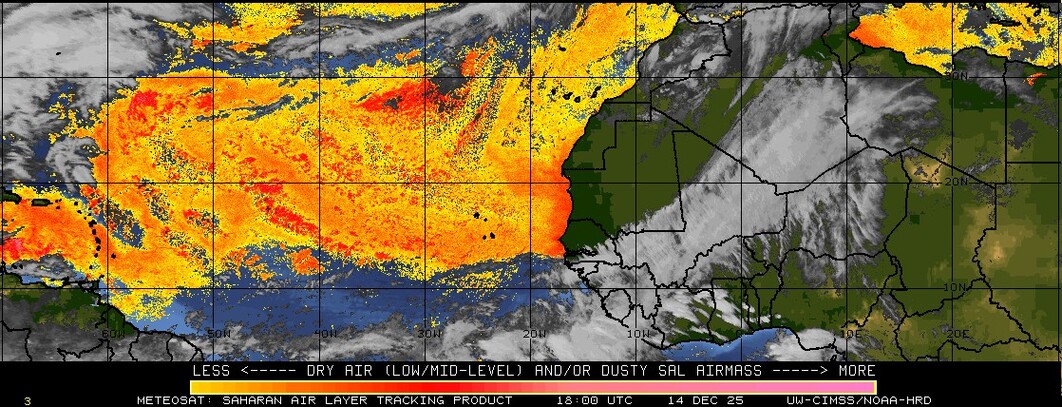
Saharan Air Layer (SAL) Analysis:
Current Southwest North Atlantic Surface Analysis:
Current Caribbean Surface Analysis:
Current Gulf of Mexico Surface Analysis:
Current Southeast US Surface Map:
Current Northern/Western Gulf Coast Surface Map:
Current Atlantic Sea State Analysis:

24-Hour NHC Surface Forecast:
24-Hour NHC Wind & Wave Forecast:
36-Hour NHC Wind & Wave Forecast:
48-Hour NHC Surface Forecast:
48-Hour NHC Wind & Wave Forecast:
72-Hour NHC Surface Forecast:
72-Hour NHC Wind & Wave Forecast:
Day 3 Forecast Surface Weather Map:
Day 4 Forecast Surface Weather Map:
Day 5 Forecast Surface Weather Map:
Day 6 Forecast Surface Weather Map:
Day 7 Forecast Surface Weather Map:
Current Atlantic 700-850 mb Mean Wind Analysis (TC Sfc Pressure Range 1000-1010 mbs):
Current Atlantic 500-850 mb Mean Wind Analysis (TC Sfc Pressure Range 990-999 mbs):
Current Atlantic 400-850 mb Mean Wind Analysis (TC Sfc Pressure Range 970-989 mbs):
Current Atlantic 300-850 mb Mean Wind Analysis (TC Sfc Pressure Range 950-969 mbs):
Current Atlantic 250-850 mb Mean Wind Analysis (TC Sfc Pressure Range 940-949 mbs):
Current Atlantic 200-700 mb Mean Wind Analysis (TC Sfc Pressure Range <940 mbs):
Current Atlantic 850 mb Relative Vorticity Analysis:
Current Atlantic 700 mb Relative Vorticity Analysis:
Current Atlantic 500 mb Relative Vorticity Analysis:
Current Atlantic Low-Level Convergence Analysis:
Current Atlantic Upper-Level Divergence Analysis:
Probability Of Tropical Cyclone Formation Within 24 Hours:

Probability Of Tropical Cyclone Formation In 24 To 48 Hours:

Vertical Wind Shear Forecast (850-200 mbs) For The Next 24 Hours:

Vertical Wind Shear Forecast (850-200 mbs) For 24 To 48 Hours:

Current Atlantic Wind Shear Analysis:
Current Atlantic Wind Shear Tendency Analysis:
Current Eastern Atlantic/African Wind Shear Analysis:
Current Sea Surface Temperature:
TROPICAL ATLANTIC WEATHER RESOURCES:
NOAA National Hurricane Center (Atlantic Ocean, Eastern Pacific Ocean, and Central Pacific forecasts )
WHO Severe Weather Information Center – Links to all Regional Specialized Meteorological Centres (RSMCs) and Tropical Cyclone Warning Centres (TCWCs)
Navy Joint Typhoon Warning Center (JTWC) – worldwide tropical cyclone advisories and warnings.
US Navy Monterey Marine Meteorology Division – Tropical cyclone track graphics and satellite imagery for all ocean basins.
Hurricane Preparedness
NHC Hurricane Preparedness section
Hurricane Strong – Federal Alliance for Safe Homes (FLASH) Hurricane prepardness
American Red Cross: Hurricane Safety
NWS: Hurricane Publications (list of NWS publications available as PDFs)
Educational Resources
NWS JetStream- Online School for Weather
NOAA Education Resources for Hurricanes
Comet MetEd resources: Choose Tropical/Hurricanes from the Topic Area pop-up menu
American Red Cross: Teaching Kids about Emergency Preparedness
Bridge Ocean Education Teacher Resource Center
University of Illinois, The Weather World 2010 Project (WW2010)
Discover Your World with NOAA: An Activity Book
Current Hurricane Model Tracks
National Center for Atmospheric Research
Weather Underground – Tropical Weather
Hurricane Imagery
NASA Hurricane/Tropical Cyclone Page
NOAA Satellite and information Service OSDPD Hazard Products
NOAA Atlantic and Caribbean Tropical Satellite Imagery
Cooperative Institute for Meteorological Satellite Studies – Tropical Cyclones
NOAA NESDIS Regional and Mesoscale Meteorology Branch – Currently Active Tropical Cyclones
USGS Coastal Change Hazards Portal
Hurricane Data
NHC Archive of Hurricane Season Reports – Includes Tropical Cyclone reports, archive tracks and GIS.
NOAA National Buoy Data Center (NDBC)- Hurricane Data and Plots
NOAA Coastal Services Center – Historical Hurricane Tracks
Additional Hurricane Resources
Hurricane Research Division (HRD) at the Atlantic Oceanographic and Meteorological Laboratory (AOML)
NOAA National Severe Storms Laboratory
Air Force Reserve 53rd Weather Reconnaissance Squadron “Hurricane Hunters”
NOAA Aircraft Operation Center P-3 Orion “Hurricane Hunter” aircraft
NOAA Aircraft Operations Center Gulfstream IV (G4) aircraft
![]()
- NOAA National Hurricane Center
- UM Rosenstiel Hurricane Portal
- CIRA/CSU Tropical Cyclones
- US Navy Meteorology
- CIMSS Tropical Cyclones
- West Atlantic SHEAR and VORTICITY
- West Atlantic VIS Floater and IR Floater
- East Atlantic SHEAR and VORTICITY
- TPW/V Wave Tracking
- MIMIC TPW
- MIMIC TC
- Real-Time ADT
- Univ at Albany
- FSU Meteorology
- Weather Underground
- NOAA/NESDIS
- NOAA/EMC
- ECMWF
- NCAR/RAL Tropical Cyclone Guidance Project
- NOAA/HFIP Model Products
- TropicalTidbits Model Products
- WeatherNerds Model Products
- NASA/GHCC GOES Interactive Viewer
- NASA/GMAO GEOS-5 Aerosol Interactive Viewer
- COLA Maximum Potential Intensity
- Tropical Atlantic Aircraft Reconnaissance
- NOAA/NDBC Buoy Observations
- NOAA/CO-OPS Tidal Observations
- SAILWX Ship Observations
- NOAA/CSC Historical Hurricane Tracks
- NOAA/WPC Historical Hurricane Rainfall
- NOAA/AOML Tropical Cyclones FAQ
- Hurricanes: Science and Society