
Seasonal forecasting is still on the cutting edge of the science of meteorology. People hear about the latest seasonal forecast model runs and El Niño/La Niña, but what actually forms our perception of how a season winds up? Is it just perception that judges whether the forecast was successful?
Of course, if you are in the energy industry, all you ultimately care about is whether the price of heating oil or natural gas went up or down (and was it volatile?). If you are in the winter storm business, you measure your success (quite literally) by how much snow fell. If you are a weather weenie, a winter is probably made by how many storms there are and if there is substantial cold and snow (for the winter) or heat and hurricanes (for the summer).
What about the climate system? How do we measure how one winter compares to the next? I am a firm believer that each season is a like a game of football – multiple, independent factors control the outcome of the game. Sometimes the offense dominates, other times its special teams and yet other times it’s the defense that pushes the team over the top.
Take the Super El Niño of 2015-16. The upper air map ended up like this:
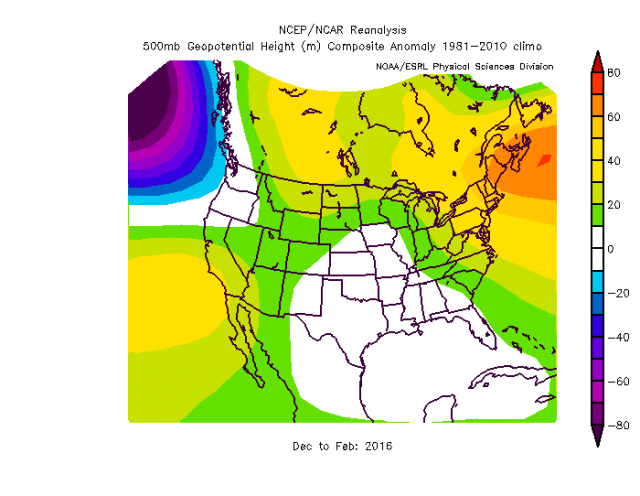
This included January which was like this, with below-normal heights over most of the U.S.:
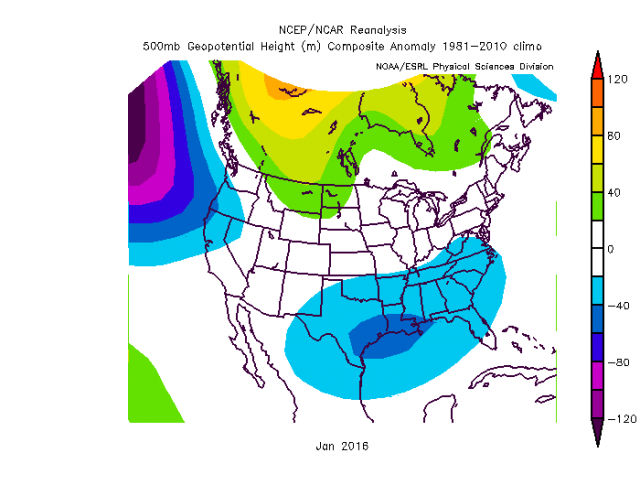
If you recall, February 14, 2016 was the first subzero day in New York City since 1994 and one of the largest snowstorms on record occurred January 22-24 – all in the midst of a Super El Niño that everyone remembers as a warm winter.
So the Super El Niño dominated most of the winter, but at other times the Arctic won out when the El Niño took a break. How will you remember that winter if you lived in NYC? A cold first three weeks of January, the coldest morning in years and the largest snowstorm in history in the midst of a mild December, late January and March.
What about the upcoming winter? This reminds me of 2013 a little.
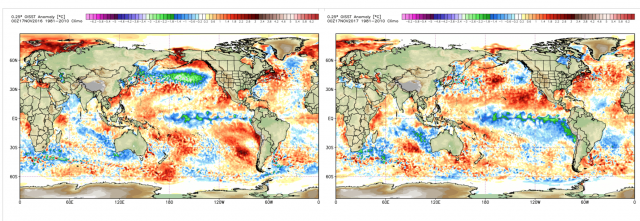
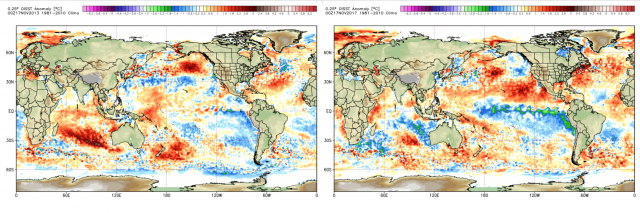
The latest Sea Surface Temperature anomaly (SSTa) map shows the La Niña building across the central and eastern Pacific.
.png)
Note the 2-month change.
What else stands out is the warming to the north-northwest of Hawaii and off the Baja Peninsula. Last fall over the same period, the water cooled in the northern Pacific with the strong jet feeding off Asia.

That is something the climate models did not see coming. Already by mid-November, it was cool where it had been warm in October. This year is warmer off Baja, as can be seen in the comparison of last year (left) versus this year (right).
Back in 2013, the water warmed in the western Gulf of Alaska and led to a warm blob by January.

Note that it was a bit farther to the east and the La Niña was weaker that year (left) versus this year (right).
That was the winter of the “polar vortex”.
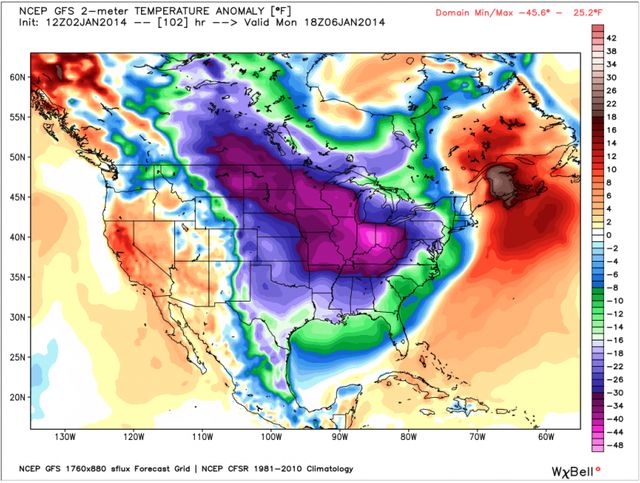
That year there were ENSO neutral conditions but it was close to a weak a La Niña. We also were toward the peak of the solar cycle with a positive QBO. All those things should imply a mild winter, but we wound up with that warm pool in the North Pacific taking control because the tropical forcings were not strong enough.
So for 2017-18, we have a weak La Niña, which can at times dominate, along with a warming of the North Pacific. That, combined with low solar activity and an easterly QBO should make for an interesting winter.