
Despite pre-season predictions of an average to below-average year, the 2018 Atlantic hurricane season was above average by most measures, with two U.S. hurricanes—Florence and Michael—causing unusually high death tolls and catastrophic damage in excess of $10 billion each. The 2018 tally of activity in the Atlantic was 15 named storms, 8 hurricanes, 2 intense hurricanes, and an Accumulated Cyclone Energy (ACE) index of 129. The 1981 – 2010 seasonal averages were 12.1 named storms, 6.4 hurricanes, 2.8 intense hurricanes, and an ACE of 105.6. The 15 named storms, 8 hurricanes, and ACE index of 129 this year put 2018 in the upper third for all of these quantities since the satellite era began in 1970.
The amount of activity in 2018 stands in stark contrast to seasonal forecasts that had called for a near- or below-average season. As explained in a weather.com analysis, this was due in part to two factors: the absence of anticipated El Niño conditions, and a significant warming of the tropical Atlantic in September, near the peak of the season. A record number of subtropical storms also pushed up the total number of named storms.

Notable records and events of the 2018 Atlantic hurricane season
– —Three Category 4 hurricanes have made continental US landfall in the past two years: Harvey, Irma, and Michael. This is the first time that three Category 4 or 5 storms have made landfall on the continental U.S. in any two-year span on record. A total of 28 Category 4+ hurricanes have made a continental U.S. landfall since 1851.
—A record seven named storms (Alberto, Beryl, Debby, Ernesto, Joyce, Leslie and Oscar) were classified as subtropical at some point. The previous record of five subtropical storms occurred in 1969. A subtropical storm is a named storm that has both tropical and non-tropical characteristics. All subtropical storms this season eventually transitioned into a tropical storm, with three (Beryl, Leslie and Oscar) eventually becoming hurricanes. According to a weather.com interview with Dr. Gerry Bell, lead seasonal hurricane forecaster at NOAA’s Climate Prediction Center, “The conditions over the central North Atlantic, where we had a lot of these subtropical systems, were extremely conducive. We had record-warm ocean temperatures and also record-weak vertical wind shear. That was certainly a player in the overall strength of the hurricane season, as far as numbers go.”
—The 2018 hurricane season was the first since 2008 to have four named storms active at the same time (Florence, Helene, Isaac and Joyce).
—For the first time since 2015, no hurricanes tracked through the eastern or central Caribbean. This gave the islands ravaged by Hurricane Matthew in 2016 and Hurricane Irma and Hurricane Maria in 2017 a much-needed reprieve. High wind shear was present over most of the Caribbean during the majority of the season, which tended to tear apart tropical cyclones.
Forecasts of rapid intensification: still a challenge in 2018
Official National Hurricane Center (NHC) track forecasts during the 2018 Atlantic hurricane season were excellent, but forecasters did not predict the full magnitude of the three major rapid intensification episodes that occurred.
At 12Z September 4, Hurricane Florence began a rapid intensification phase that brought it from a low-end Category 1 hurricane with 75 mph winds to a Category 4 storm with 130 mph winds in 36 hours. The official NHC intensity forecast issued the morning of September 4 was a bust, calling for Florence to weaken to a tropical storm with 70 mph winds in that 36-hour period, due to high wind shear. The forecasts from the SHIPS and DTOPS intensity models were also a bust, predicting a 10% and 0% chance of rapid intensification, respectively, with their 12Z September 4 forecasts.
After weakening to a tropical storm from September 7 to 9, Florence underwent a second round of rapid intensification, with a 65 mph increase in winds in the 36 hours beginning at 12Z September 9. NHC’s intensity forecast from the morning of September 9 did a good job this time, predicting a 45-mph increase in winds for that 36-hour period. However, Florence then weakened more than expected before landfall. The forecast at 5 pm EDT September 12 called for Florence (then packing 120-mph winds) to approach the coast as a low-end Category 3 storm with 115-mph winds late on September 14, whereas the hurricane made landfall on the morning of September 14 as a Category 1 with top winds of 90 mph.
Hurricane Michael’s winds increased from 90 mph to 155 mph in the 36 hours prior to landfall, between 6Z October 9 and 18Z October 10, a 65 mph increase in winds. The NHC intensity forecast from 9Z October 9 called for just a 30-mph increase in winds during that period.
Alberto makes it to Michigan as a tropical depression
Tropical Storm Alberto made landfall in the Florida Panhandle on May 28 with top winds of 45 mph. According to the NHC final report on the storm, flooding from Alberto killed 5 people in North Carolina and 3 people in Virginia, with U.S. damage estimated at $125 million, according to Insurance broker Aon. Two of these deaths occurred from a toppling tree in Polk County, North Carolina, which killed a news anchor and photojournalist who were covering the impact of the storm’s rains. In Cuba, flooding from Alberto killed 10 people, and damage was in the millions.
After starting out as a subtropical storm in the Western Caribbean, Alberto peaked with 65 mph sustained winds while it was approaching the Florida Panhandle coast. Although Alberto was still classified as a subtropical storm when it made landfall, NHC’s final report concluded that Alberto had actually evolved into a tropical storm before it reached the Florida coast.

After making landfall, Alberto became a tropical depression that held together for three more days during its trek northwards into the Great Lakes. Alberto was finally declared post-tropical in northern Michigan on Thursday morning, May 31. As a result, Michigan experienced a tropical depression this year before any of the coastal U.S. states did!
Hurricane Beryl: an early-season oddity
Hurricane Beryl was first named at 10.1°N, 38°W, on July 5—the furthest southeast in the Atlantic that a named storm has formed that early in the season on record. Beryl peaked as a Category 1 hurricane with 80 mph winds east of the Lesser Antilles Islands, but high wind shear and dry air reduced it to a tropical wave before the storm moved through the islands on July 8.
Tropical Storm Gordon: a quick hit on the Central Gulf Coast
Tropical Storm Gordon made landfall with top sustained winds of 70 mph just west of the Mississippi/Alabama border on the night of September 4, less than 48 hours after becoming a tropical storm in the eastern Gulf. Gordon’s impact was muted by its irregular structure, as the storm never developed a solid, complete eyewall despite several attempts to do so. Still, Gordon resulted in at least three deaths and damage estimated at more than $250 million, as Gordon’s heavy rains made it as far north as the Ohio Valley.
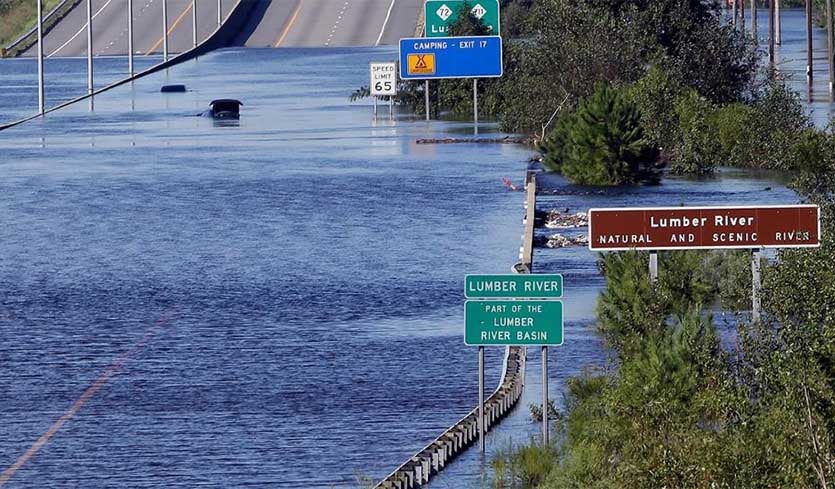
Hurricane Florence causes catastrophic flooding in the Carolinas
Hurricane Florence made landfall at Wrightsville Beach, North Carolina on September 14 as a Category 1 hurricane with 90 mph winds, bringing catastrophic flooding. At least 53 direct or indirect deaths were blamed on the storm, and Aon estimated that total economic losses would exceed $10 billion.
Florence slowed to a crawl as it moved inland, bringing record rains and record river flooding. A wide swath of North Carolina and a small section of South Carolina experienced 72-hour rains that, on average, occur every 1,000+ years (have a 0.1% chance of occurring in any given year). More than 30” of rain was recorded at several North Carolina stations, including 35.93” at Elizabethtown—an all-time record for the wettest tropical cyclone ever observed north of the Gulf Coast states. Heavy rainfall also occurred in South Carolina, with 23.63” observed near Loris—a new state record for rainfall from a tropical cyclone.
Climate change made Florence’s most intense rains over North Carolina more than 50% greater in magnitude than they would have been otherwise, according to a first-of-its-kind experimental “pre-attribution” study done as the storm was approaching landfall. Florence was also likely 8 – 9% greater in areal size due to climate change, and the storm was more likely to stay at a high Saffir-Simpson category as it approached landfall, the researchers found, using a climate model that generated forecasts with and without climate change factored in.

At least five river gauges observed record flooding in NC, topping what was seen in Hurricane Matthew (2016) and Hurricane Floyd (1999). Also, the Waccamaw River near Conway, SC had record flooding, topping Hurricane Matthew’s 2016 flood by more than 3 feet. It took two to three weeks for many river locations to fall below flood stage, with one river cresting a full month after Florence made landfall.
Hurricane Florence was only a Category 1 storm on the Saffir-Simpson wind scale when it struck, but the hurricane’s massive wind field brought a huge storm surge to the coast that broke all-time high-water records as much as 65 years old. Two of the three tide gauges on the south coast of North Carolina that have long-term records going back to 1954 or earlier (Beaufort and Wilmington) saw those records fall, and the other station (Wrightsville Beach) notched its third highest water level on record. Long-term storm surge records like this are very difficult to break, which speaks to how large and dangerous Florence’s storm surge was.
The largest storm surges reported from Florence were in New Bern and Emerald Isle, North Carolina, where water levels reached 10.1 feet and 7.0 feet above ground, respectively, according to the National Hurricane Center. New Bern, a city of about 30,000 residents, saw significant storm surge flooding after the Neuse River overflowed its banks and swept into the town, trapping people on their roofs.
As reported by axios.com, Hurricane Florence’s storm surge affected more than 51,000 homes by pushing water over 25% or more of each property. Sea level rise along the Carolina coast of 6 inches since 1970—largely due to human-caused climate change—caused Hurricane Florence to “significantly affect” 11,000 of those 51,000 homes.
Florence took a very unusual track across the Atlantic to reach the U.S. East Coast, thanks to a blocking ridge of high pressure that did not allow the storm to recurve to the north. No tropical storm or hurricane in recorded history had passed within 100 miles of where Florence was located on Sept. 7, in the Central Atlantic at Florida’s latitude, and still made a U.S. landfall.

Hurricane Michael: one of the four strongest landfalling mainland U.S. storms on record
Hurricane Michael made landfall at 2 pm EDT October 10, 2018 near Mexico Beach, Florida, with top sustained winds of 155 mph and a central pressure of 919 mb. Hurricane Michael’s landfall pressure was the third lowest for a continental US hurricane landfall on record, trailing only the Labor Day Hurricane of 1935 (892 mb at landfall) and Hurricane Camille of 1969 (900 mb at landfall). Hurricane Michael’s landfalling winds were the fourth highest for a continental U.S. landfall on record, trailing only the Labor Day Hurricane of 1935 (185 mph), Hurricane Camille (175 mph), and Hurricane Andrew (165 mph).
Hurricane Michael’s winds and storm surge wreaked catastrophic destruction in Mexico Beach, where the strongest winds of the right-front eyewall came ashore. According to preliminary estimates from state emergency management offices, the storm caused at least 49 deaths in the U.S., of which 14 may be considered direct deaths due to storm surge, winds, and flooding. Preliminary damage estimates from Aon are $15 billion, including $2.3 billion in damage to the Florida and Georgia timber industries and $2 billion in agricultural damage to Georgia. Public and private insurers—including the National Flood Insurance Program and the USDA’s crop insurance program—were expected to make more than $8 billion in payouts. Severe devastation occurred on Tyndall Air Force Base, where 17 F-22 stealth fighter planes worth a combined $6 billion suffered damage.
Michael maintained hurricane strength for nine hours after landfall and tracked inland a remarkable 175 miles into central Georgia before being downgraded to a tropical storm. According to data at NOAA’s historical hurricanes web site, nine other hurricanes since 1851 have tracked farther inland than that as a hurricane into Georgia. The only named hurricane (since 1950) to do so was Hurricane Kate of 1985.
Before Michael became a named storm, rainfall from the Central American Gyre that would eventually become Hurricane Michael spawned flooding across multiple countries in Central America, causing damage of at least $100 million. The worst affected country was Honduras, with tens of thousands of people impacted and eight killed.
Michael made landfall more than a month later than all of the historic storms that were stronger, making it the strongest hurricane on record to reach the mainland U.S. so late in the year. One good reason for this is the exceptionally warm ocean waters in the eastern Gulf of Mexico that powered Michael. Florida had its warmest September on record in 2018, and that helped heat up the waters of the eastern Gulf to 2 – 4°F (1 – 2°C) above average. Global warming makes record-warm Septembers like Florida experienced more likely to occur, and thus made a record-strong late-season hurricane like Michael more likely to occur.
Michael’s timing also worked in favor of a devastaing landfall. Its inner core did not fully organize until just a few hours before it reached the coast, and this allowed Michael to make landfall while still intensifying, as opposed to the more common scenario of a hurricane weakening just before landfall. Michael intensified at an unusually rapid pace right up until landfall, with a 45 mph increase in winds in the 24 hours prior to landfall. Historical records show that since 1950, this ranks at the fifth greatest 24-hour intensification rate prior to a U.S. landfall:
Humberto, 2007 (65 mph increase)
King 1950 (60 mph increase)
Eloise 1975 (60 mph increase)
Danny 1997 (50 mph increase)
Michael 2018 (45 mph increase)
Harvey 2017 (40 mph increase)
Cindy 2005 (40 mph increase)
As explained in our October post, Dangerous Rapidly Intensifying Landfalling Hurricanes Like Michael and Harvey May Grow More Common, hurricanes that happen to perform their rapid intensification just before landfall are very dangerous, since they are more likely to hit an unprepared population. Warming oceans due to human-caused climate change will cause future hurricanes to intensify at unprecedented rates, increasing the incidence of this very dangerous breed of hurricanes. See the Climate Signals website for more on the links between hurricanes and climate change.
Michael brought a storm tide in excess of 15’ to the coast at Mexico Beach, with several high-water marks (from waves on top of the surge) of over 20’ being recorded. One NOAA tide gauge with long-term records set an all-time high water mark during the storm, at Apalachicola, FL, where the storm tide peaked at 7.72’ above high tide (Mean Higher High Water, or MHHW). Hurricane Dennis of 2005 (a 6.43’ storm tide) held the previous record (records extend back to 1967). The storm tide at Panama City, FL tide gauge peaked at 5.31’ above MHHW, which was the second highest water level on record. The record is 5.72’ above MHHW, set on October 4, 1995 during Hurricane Opal. Records extend back to 1973 at the site.

Ex-Hurricane Leslie causes heavy damage in Portugal
Hurricane Leslie maintained hurricane status into the far Eastern Atlantic to a location where no hurricane had ever been observed: just 200 miles west of Portugal. Just 3 hours after being declared post-tropical, ex-Hurricane Leslie made landfall on the coast of central Portugal on October 13, 2018, with top sustained winds of 70 mph. Damage in Portugal was over $115 million, making Leslie one of their costliest wind storms on record.
Leslie was the latest in a series of unusual tropical cyclones that we have seen in recent years in the far Eastern Atlantic, in locations or with intensities that are extremely rare or unheard of in the historical record. In most cases, we can say that the odds of these oddball storms forming were increased by human-caused global warming, since tropical storm formation in the far Eastern Atlantic is primarily limited by cool ocean temperatures. A short list of other unusual Eastern Atlantic tropical cyclones since 2005:
—Tropical Depression Vince hit southern Spain 2005, bringing heavy rains to both Spain and Portugal, but no significant damage. Vince developed into a hurricane farther east than any other known storm, at 18.9° W. Vince was the first tropical cyclone on record to have made landfall on the Iberian Peninsula since the 1842 Spanish hurricane.
—Hurricane Ophelia of 2017 became the farthest-east major hurricane observed in the satellite era. Just 12 hours after being declared post-tropical, ex-Ophelia hit Southwest Ireland on October 16 with near-hurricane-force winds, killing three people and causing over $100 million in damage.
—Hurricane Fred passed through the Cabo Verde Islands on August 31, 2015, becoming the first hurricane to do so since an 1892 storm. Fred was blamed for nine deaths and $1 million in damage.