
March 14, 2018
- Analogs are based off last year.
- Double weight to 1951 and 2006
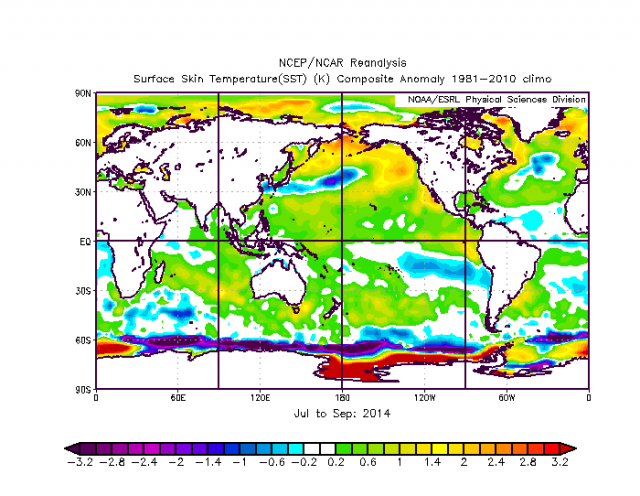
- 2014 added as SSTs are the closest match.
- Next update with an impact map will be issued around April 10.
Total Storms 11-15
Hurricanes: 5-7
Major Hurricanes: 1-3
ACE: 90-110 (near normal)
Forecasted SSTs off the Euro are similar to 2014, a relatively down year:
The surface pressure pattern from July-September off the Euro Seasonal shows higher than normal pressures in the Tropical Atlantic. There is an awful lot of high pressure over land and in the North Atlantic again. However, there are higher pressures over the Gulf and into the Sargasso Sea. This suggests that a lot of the intensity is going to be near and off the East Coast of the U.S. and into the central Atlantic.
I am now officially fascinated with how using those same 5 analogs from last year based on the tropical season is still working for the spring. The April to June temperature and precipitation forecasts off those analogs are spooky close to the blend of the Euro and CFSv2 models. Why not dance with the horse that brung us and assumes, hemispherically, that those analogs are pointing to a similar theme continuing the year after a hyper season?
Note that two of the analogs (now a year later), 1951 and 2006, had weak El Niños develop. In three of the years, 1951 with an El Niño, 1996 and 2011, fairly active seasons followed. There is an interesting blend of solutions that in March still demand my attention.
1934:
There was not a lot of intensity in the Main Development Region that year.
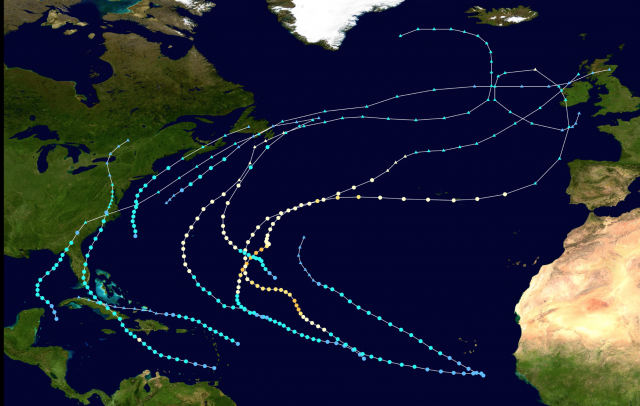
1951 was an El Niño year with a big ACE total, but little major impact. Once again higher intensities were to the north of 20°N:
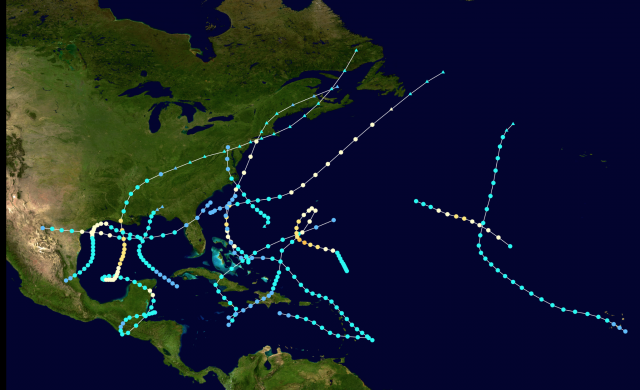
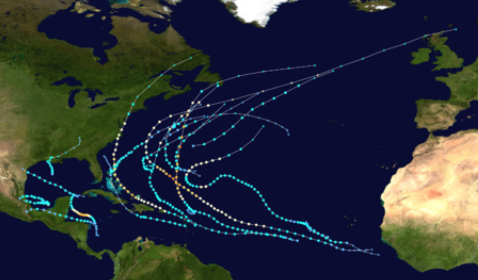
1996 was a big year with lots of hits:
.png)
2006 was a relatively harmless season, though Ernesto on Labor Day raised a ruckus (though not named at the time) with hurricane gusts from Virginia Beach to New Jersey.
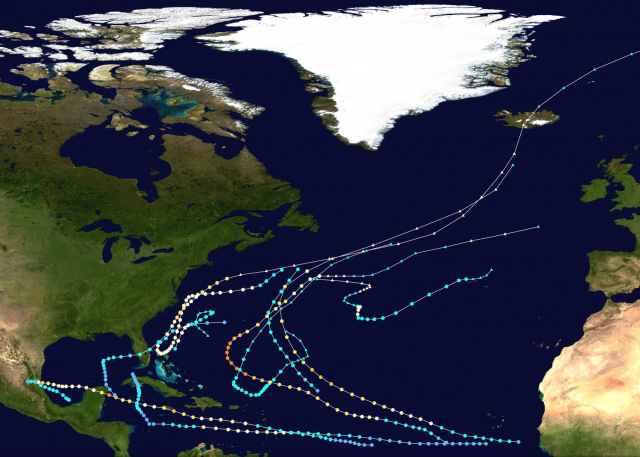
2011 was a low impact year but was active:
The AMO and TNA values have turned negative. While there is always a danger that we could follow along with the lines of 1950-51 and 1995-96 with double big impact years (with a lesser degree of impacts in 2010-11), I am forecasting a normal year overall.
The Verdict
As far as impact, unlike last year when we plainly had the U.S. in the cross-hairs, this year it looks like the U.S. will be on the western edge of the highest ACE area (50% or more). This will extend between 30°N and 40°N from the U.S. coast to 55°W. If I had to draw it today, the centering of the area of greatest activity would not be like last year. Look for storms to be stronger farther to the north and east than 2017.