Today’s update will come in two parts, this being part one, focusing on the tropical Atlantic. The season has gotten off to a slow start, but we’re only just entering climatological peak season. The only two hurricanes of the season so far both occurred in July, with a near total lack of activity during the month of August. What’s been behind the lack of activity, and are we in for a change? This post will look at question number one, examining a range of culprits from large-scale circulation patterns to sea surface temperatures.
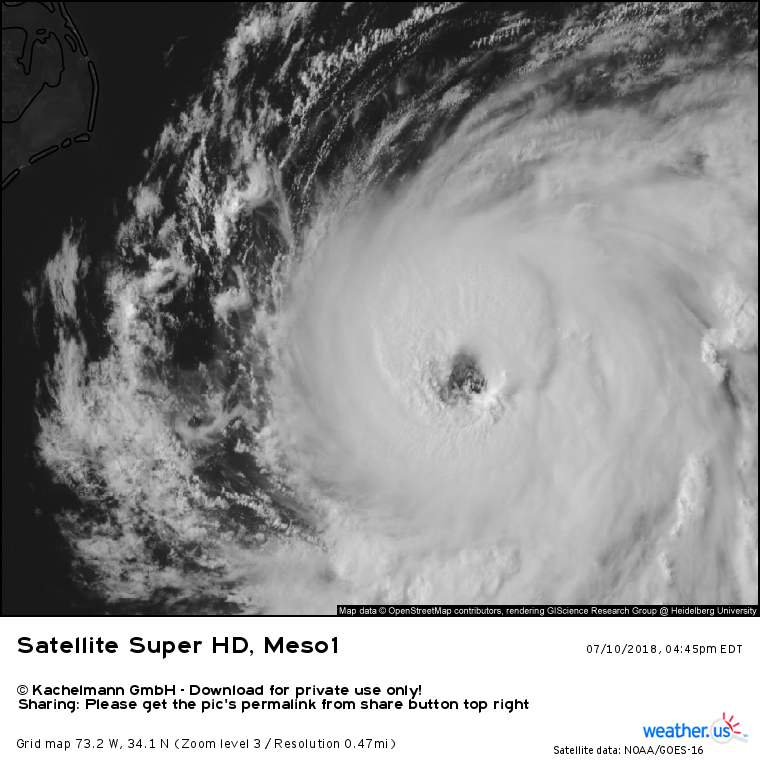
The 2018 Atlantic hurricane season initially got off to a very fast start, with two hurricanes forming in the month of July. The stronger of the two, hurricane Chris pictured at left, fell just short of Major hurricane (category 3) status as it raced northeast off the US East Coast. The weaker storm, Beryl (not pictured) reached its peak intensity east of the Windward Islands.
However, activity has since slowed dramatically. Accumulated Cyclone Energy (ACE) is widely recognized as the best way of measuring tropical cyclone activity, as it takes into account not just how strong winds are, but also for what duration a storm produced those winds. So a short-lived intense storm may actually produce less ACE than a long-lived storm of moderate intensity. Therefore, ACE becomes a good metric to analyze overall activity in a given basin for a given season. The higher the ACE, the more long-lived/intense storms the storms in that basin were.
So far in 2018, the North Atlantic has racked up 16.98 units of ACE, most (~12 units) of that coming from the storms in July. This is well below what we’d expect for this time of year, which is 27 units. All that to say, we’ve been off to a slow start. Why?
The plot below shows a parameter known as “Velocity Potential Anomalies” in the upper atmosphere. Simply put, velocity potential can be used to generally estimate areas of rising and sinking air. Locations with -VP anomalies (lower VP than what’s climatologically ‘expected’) will see generally favored rising motion, while the opposite is true for areas with +VP anomalies.
Notice that these values are obtained from an average of 30 degrees latitude (from 15S to 15N). This map is meant to reflect large-scale patterns, beyond the synoptic scale. This means that areas with -VP anomalies won’t see constant thunderstorm activity for months on end, while areas with +VP anomalies won’t become deserts. It would be more accurate to describe VP anomalies as modulating convective activity anomalies, rather than the convective activity itself. Areas with -VP anomalies will see more than normal convective activity, while areas with +VP anomalies will reflect the opposite.
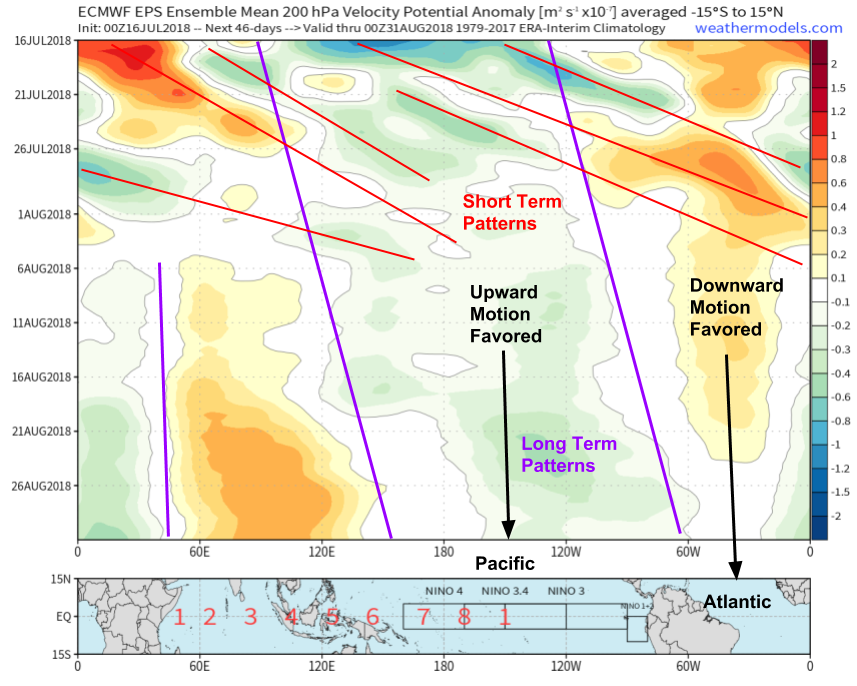
Because tropical cyclones are, at their root, organized clusters of thunderstorms, it makes sense that if there are more thunderstorms than normal in a given area, there is a higher than normal chance of tropical cyclone development, generally speaking. Remember we’re talking whole basins here (notice wavelength of long-term patterns on the plot above). Individual disturbances may still struggle for a variety of reasons in a -VP regime, or vice versa in a +VP regime, and may also be influenced by short-term VP anomalies on the synoptic timescale. The short-term anomalies fade about two weeks into the forecast because of uncertainties in synoptic-scale patterns at that range. Notice though how the large-scale patterns remain intact, with the ensemble system remaining (reasonably) confident in their placement through D46.
The plot above shows VP anomalies for the second half of July and the month of August, from a forecast issued on July 16th by the ECMWF’s long-range ensemble prediction system (EPS). While technically a model forecast, I use this because the forecast ended up verifying (on the large scale), and it highlights why the Atlantic has been so quiet. Notice the persistent area of +VP anomalies between 15W and 60W. Air has generally been sinking here for the past month and a half or so, which has suppressed thunderstorm activity. Suppressed thunderstorm activity makes it hard (or in this case impossible) for tropical waves to grow into tropical cyclones.
It’s important to note that there have been other factors behind the quiet start to the season as well. Frequent outbreaks of Saharan Dust have led to an abundance of mid-level dry air over the tropical Atlantic. When mid-level dry air gets entrained into thunderstorm updrafts, the resulting evaporation cooling (which comes from the latent heat transfer as liquid water molecules evaporate into gaseous water vapor) leads to the air inside the updrafts becoming extremely “heavy” (cold/dense). The heavy air then sinks towards the ground (as heavy things like to do), which shuts off the updraft and kills the storm. The GIF above shows very dry dusty air streaming across the Atlantic in early August.
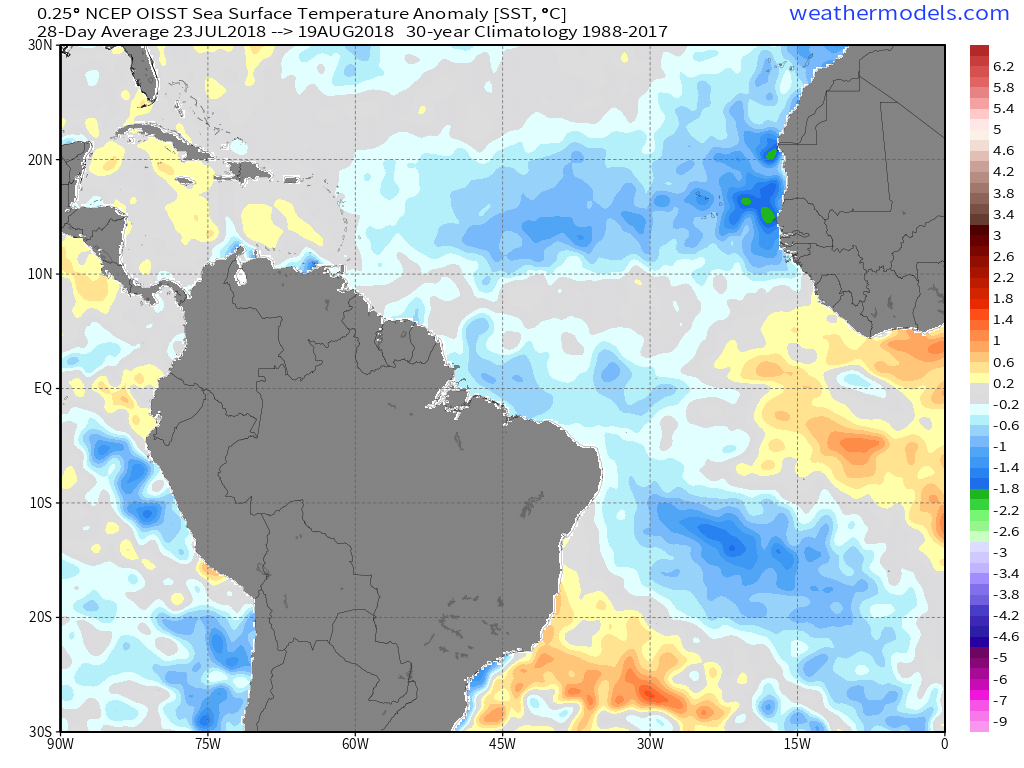
Another important piece to the puzzle is sea surface temperature anomalies. Tropical cyclones need warm sea surface temperatures to support their thunderstorms. Latent heat fluxes from the warm waters to the atmosphere is where tropical cyclones draw their strength. Lower sea surface temperatures mean less energy available for tropical cyclones, and if the waters are cold enough, the storm won’t have enough energy to get going in the first place. 28 day SST anomalies from late July through mid-August show much cooler than normal SST’s in the area of the Atlantic where many storms get going, known as the Main Development Region (MDR).
Large-scale sinking motion (shown by +VP anomalies), frequent outbreaks of Saharan dust, and cooler than normal sea surface temperatures have all played important roles in a quiet month for the Atlantic basin in terms of tropical cyclone activity. After the very active, and very destructive, 2017 season, I’m sure there are few complaints about the tranquility. That being said, we’re only now getting into the climatological peak of hurricane season. What does the forecast look like going forward? You’ll have to Stay Tuned to this page for the outcome.