
Hello everyone!
A very active pattern is set to develop across the US this weekend as tropical cyclones across the Pacific disrupt the Northern Hemisphere’s jet stream. While the pattern may be originating over distant seas, the effects will be prominent from coast to coast here in North America. Heavy snow will fall in the Rockies, potentially accumulating several feet at high elevations. To the east, strong storms will develop in the Plains bringing torrential rains and severe weather. Farther south, we’ll have to worry about tropical troubles in the Gulf of Mexico as a developing disturbance moves north out of the Caribbean. In short, there’s something to watch for just about everyone!
This post will focus on the front end of the medium range, meaning the latter half of the long weekend into the first part of this week. This includes Rocky Mountain snow, Central Plains heavy rain, and Southern Plains severe weather. Any potential impacts from the tropical disturbance will hold off until late next week at the earliest, so I’ll discuss that system later. It’s also possible that another storm will develop in the Plains next week, resulting in another round of snow/storms, but as with the tropical system, I’ll cover that later.
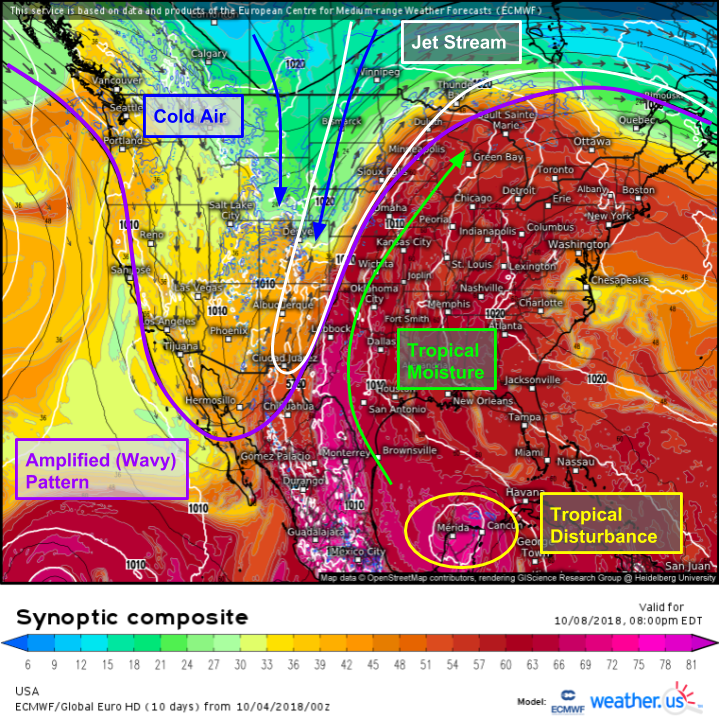
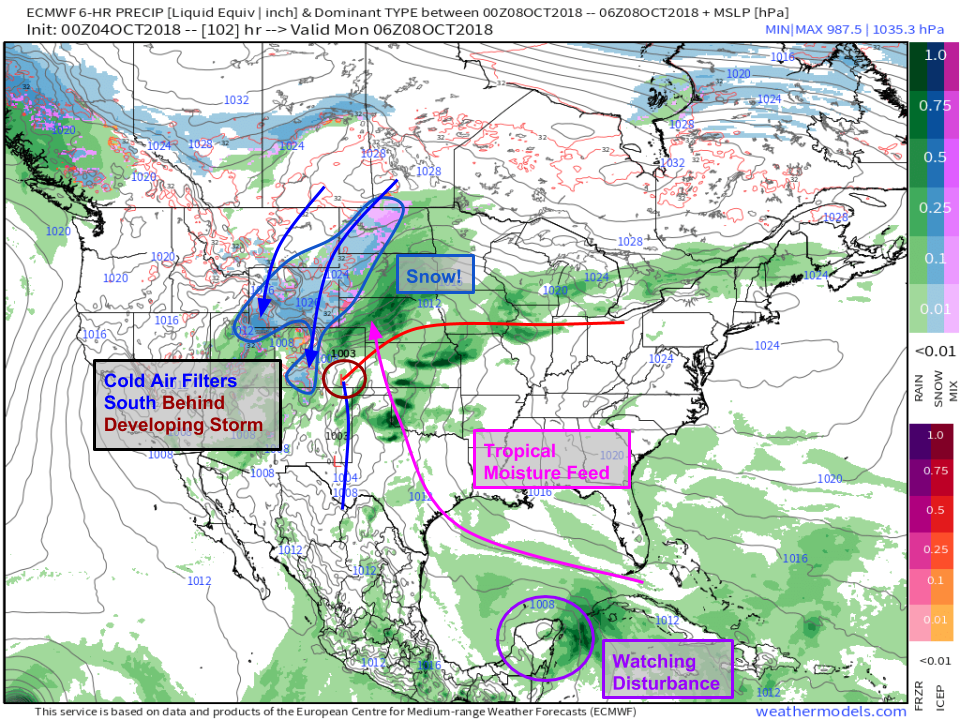
Here’s a look at the forecast pattern on Sunday night, visualized by the ECMWF’s synoptic composite map (what’s that?). The amplified (wavy) pattern in the upper levels is clearly visible, with tropical moisture flowing north across the Plains, and cold air filtering south through the Rockies. Looking at the vector field (300mb winds), a strong jet streak is also noted just east of the Rockies. The theta-e shading, which is a measure of heat/moisture shows warm moist air (high theta-e) moving north ahead of a frontal boundary that divides the two airmasses, while to the west, cooler/drier air (low theta-e) is moving south. The frontal boundary where these airmasses meet will be the focal point for storms throughout much of the week.
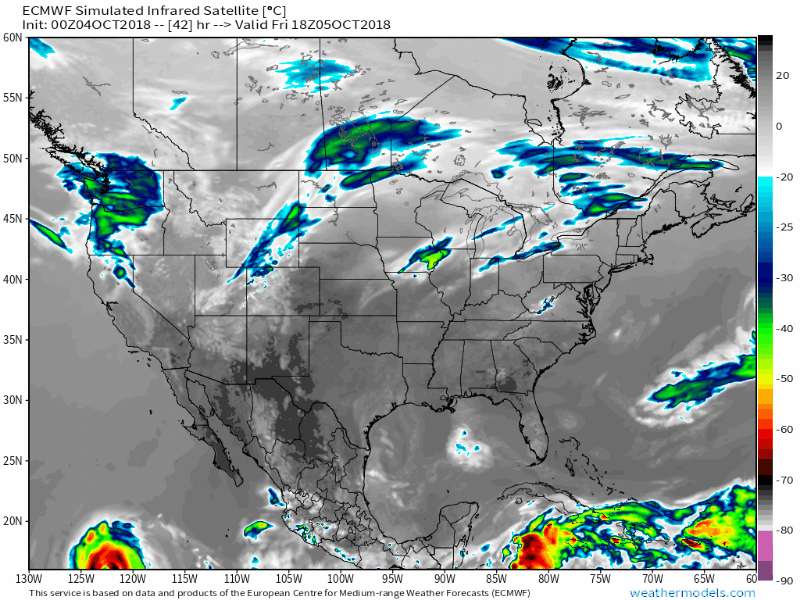
This animation from the ECMWF model via weathermodels.com highlights that persistent storm activity. The parameter displayed here is the model’s simulation of what satellite imagery might look like in the future. The brighter colors indicate colder cloud tops, and therefore storms. Note the bright colors (storms) continuously appearing over the Plains as those two airmasses clash day after day. Stormy times are ahead!
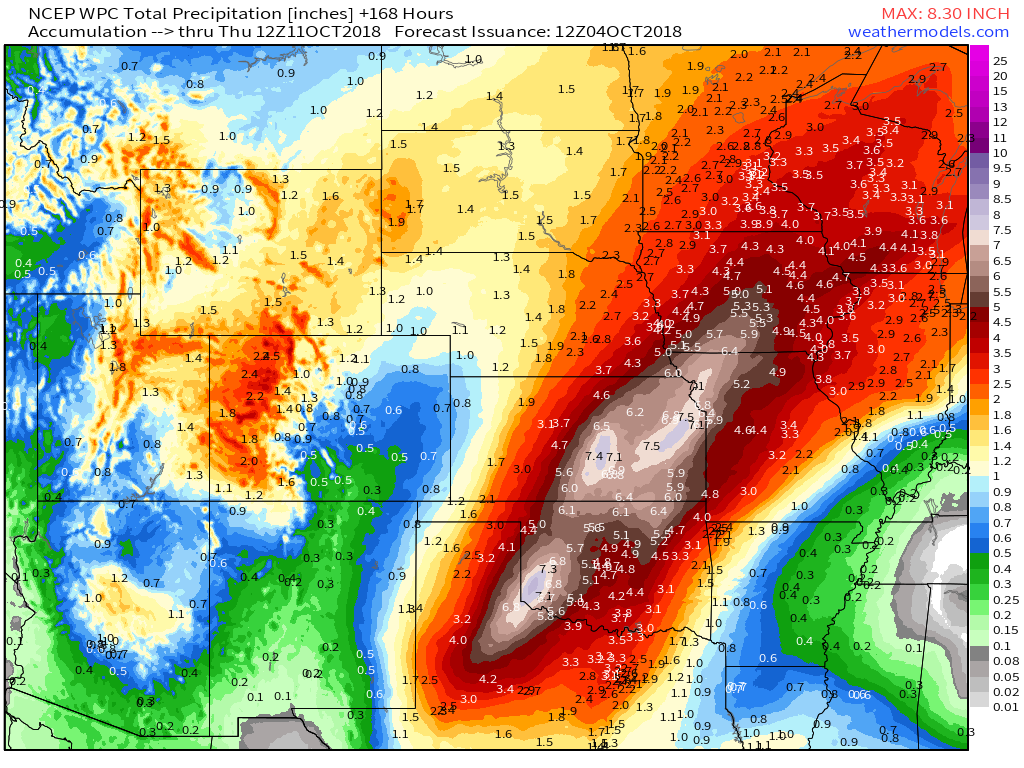
These storms will likely produce some severe weather, though the exact magnitude/extent/type of threat posed by severe weather will come down to small scale details that are hard to predict several days in advance. However, one threat to watch for regardless of the severe weather setup on any given day is rain. Intense thunderstorm activity impacting the same areas day after day will lead to rainfall totals piling up. This forecast from the Weather Prediction Center (a branch of the National Weather Service) shows rainfall totals potentially exceeding 7″ over the next week from Northern Texas through Iowa. The exact totals observed in any given town will depend on the exact placement of individual storm cells, but signals are very strong for widespread heavy rains leading to flooding threats, both in terms of small streams and larger rivers. While widespread river flooding isn’t expected, 7″ of rain over a fairly wide area will lead to river rises that could inundate typically susceptible low lying areas. Map via weathermodels.com.
Farther west, in the cooler airmass, snow is expected across the Rockies this week. Tropical moisture feeding the heavy rain in the Plains will get pulled west by that jet streak I mentioned earlier. As that moisture runs into the cooler air and the Rocky Mountains, it will rise, resulting in snow. Because it’s still early October and the cold air tap available to this system is fairly weak, widespread low elevation snows are not expected. However, the higher peaks of Colorado, northern Utah, and Wyoming could pick up quite a bit of snow.
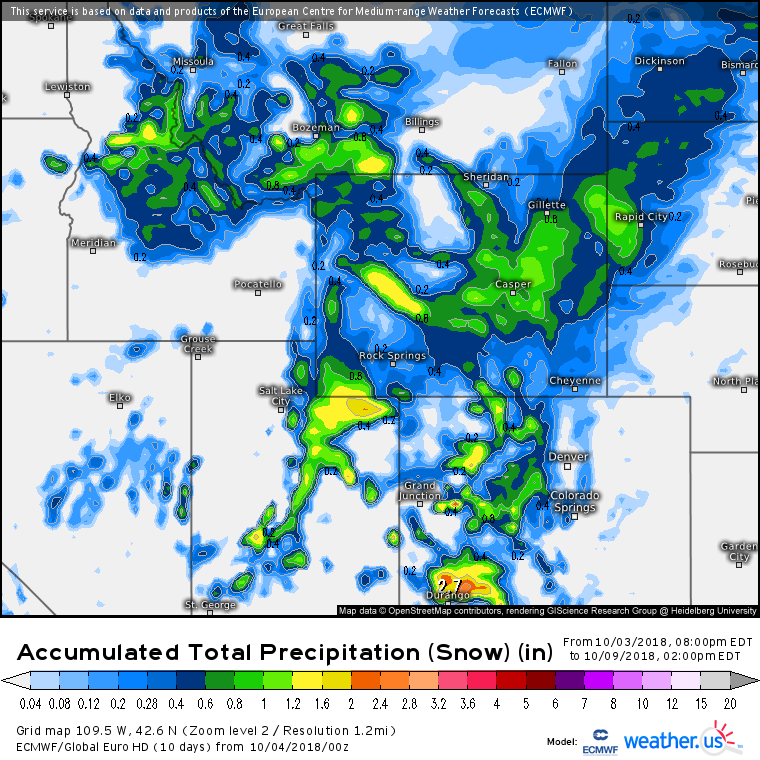
This map from the ECMWF shows how much liquid-equivalent precipitation is forecast to fall as snow this weekend and during the first part of next week. To get snowfall totals, multiply these values by a snow:liquid ratio, generally around 10 or 12:1, meaning that for every 1″ of liquid equivalent precipitation, 10-12″ of snow will fall. Note that these ratios will be lower in the valleys, and higher towards the peaks. This is why “standard” snow maps that just multiply by 10:1 everywhere don’t paint the full picture of a potential snow event, especially early in the season. For more info on liquid equivalent snow forecasting, check out this post.
Many of the peaks are forecast to recieve between 1 and 2 inches of liquid equivalent this weekend, which translates to roughly 18-30″ of actual snow accumulation. Lower elevations will see less than a half inch of liquid equivalent fall as snow, and with ratios below 10:1 (remember it’s hard to accumulate on still-warm surfaces early in the season!), actual totals may struggle to eclipse an inch or two. The valley floors are unlikely to see any accumulation, as it’ll be simply too warm.
I’ll have more updates on individual severe weather threats as we approach them, and will also discuss the tropical disturbance lurking in the Caribbean if it still appears to be a threat in a few days.