

Welcome to First Alert Hurricane
& Extreme Storm Center
hattiesburg bobby l chain municipal airport weather forecast
Welcome to the First Alert Hurricane Center
First Alert Hurricane Center provides Weather Forecasts, Updates, and Alerts for the United States including Severe Weather, Winter Weather, and our specialty, Tropical Weather. We run our site on Professionalism and Dedication and are well known for our custom weather graphics and descriptive up-to-the-minute forecasts. Providing accurate, no-hype weather information to the public as per of being an Ambassador to the National Weather Service’s Weather-Ready Nation.
Mission: During dangerous weather conditions, not all have access to a TV. With our Facebook awareness posts and dedicated team, we provide word of the oncoming event with multiple awareness forecasts yet educate them in the process. Our number one goal is to aware with accuracy. What We Do: From forecasts to alerts to free giveaways, First Alert Hurricane is your #1 site on Facebook and Twitter to get your weather information. We have proven ourselves in the weather field by the magnitude of fans who follow us including the millions who reached out to us during Hurricanes for the latest forecasts and information.
We specialize in Tropical Weather and live by one sang over “Accuracy over First” -meaning we believe it is important to be accurate on the forecast rather than “first” to predict its track [whether it is right or not]. Here at First Alert Hurricane Center, you will see the latest Severe Weather Forecasts, Model Predictions, Long Range Forecasts, National Forecasts, Tropical Weather Forecasts, Free Giveaways, Contests, Educational Posts, and More Weather Fun!
First Alert Hurricane Center is the first and only partnered website along the Gulf Coast to feature both an online weather community, along with a team of Advanced Trained Storm Spotters and Professional Meteorologists such as Jason Scott are all on board for one purpose….to keep you safe and informed, while at the same time inviting you for your opinions and welcoming discussions 24 hours a day, 365 days a year.
.
Categorical Outlook Mississippi Day 1:

Categorical Outlook Mississippi Day 2:

Categorical Outlook Mississippi Day 3:

2 Day Graphical Tropical Weather Outlook:

Latest Tropical Weather Outlook:
Latest Tropical Weather Discussion:
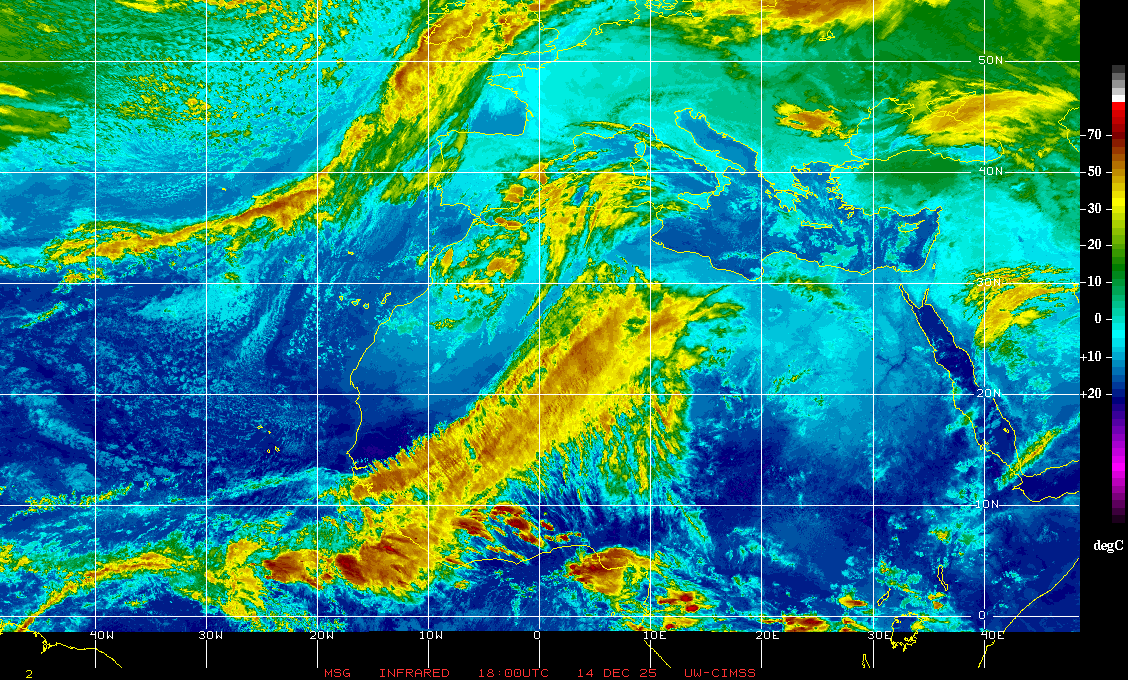
Tropical Atlantic Wide Infrared Satellite Image:


Gulf Of Mexico Infrared Satellite Image:


US East Coast Infrared Satellite Image:

Caribbean Infrared Satellite Image:

Tropical Atlantic Wide Visible Satellite Image:


Gulf Of Mexico Visible Satellite Image:


US East Coast Visible Satellite Image:

Caribbean Visible Satellite Image:

Tropical Atlantic Wide Water Vapor Satellite Image:


Gulf Of Mexico Water Vapor Satellite Image:


US East Coast Water Vapor Satellite Image:

Caribbean Water Vapor Satellite Image:

Eastern Atlantic Infrared Satellite Image:
Eastern Atlantic Infrared Satellite Image:

Eastern Atlantic Visible Satellite Image:

Eastern Atlantic Water Vapor Satellite Image:

Bahamas Radar Links:
Bermuda Radar Links:
Radar Loop From Bermuda Weather Service
Static Radar Images From Bermuda
Bermuda Radar & AWOS
Jamaica/Hispaniola Radar Links:
Jamaican Radar Imagery
Cuba & Jamaica Radar Mosiac
Eastern Cuba/Haiti Radar Imagery
Cuba Radar Sites
Lesser Antilles & Barbados Radar Links:
Antilles Radar Imagery
Barbados Radar Imagery
St. Maarten Radar Loop
ABC Islands Radar Imagery
Mexico & Central America Radar Links:
Mexican Radar Imagery
Belize Radar Imagery
Panama Radar Imagery
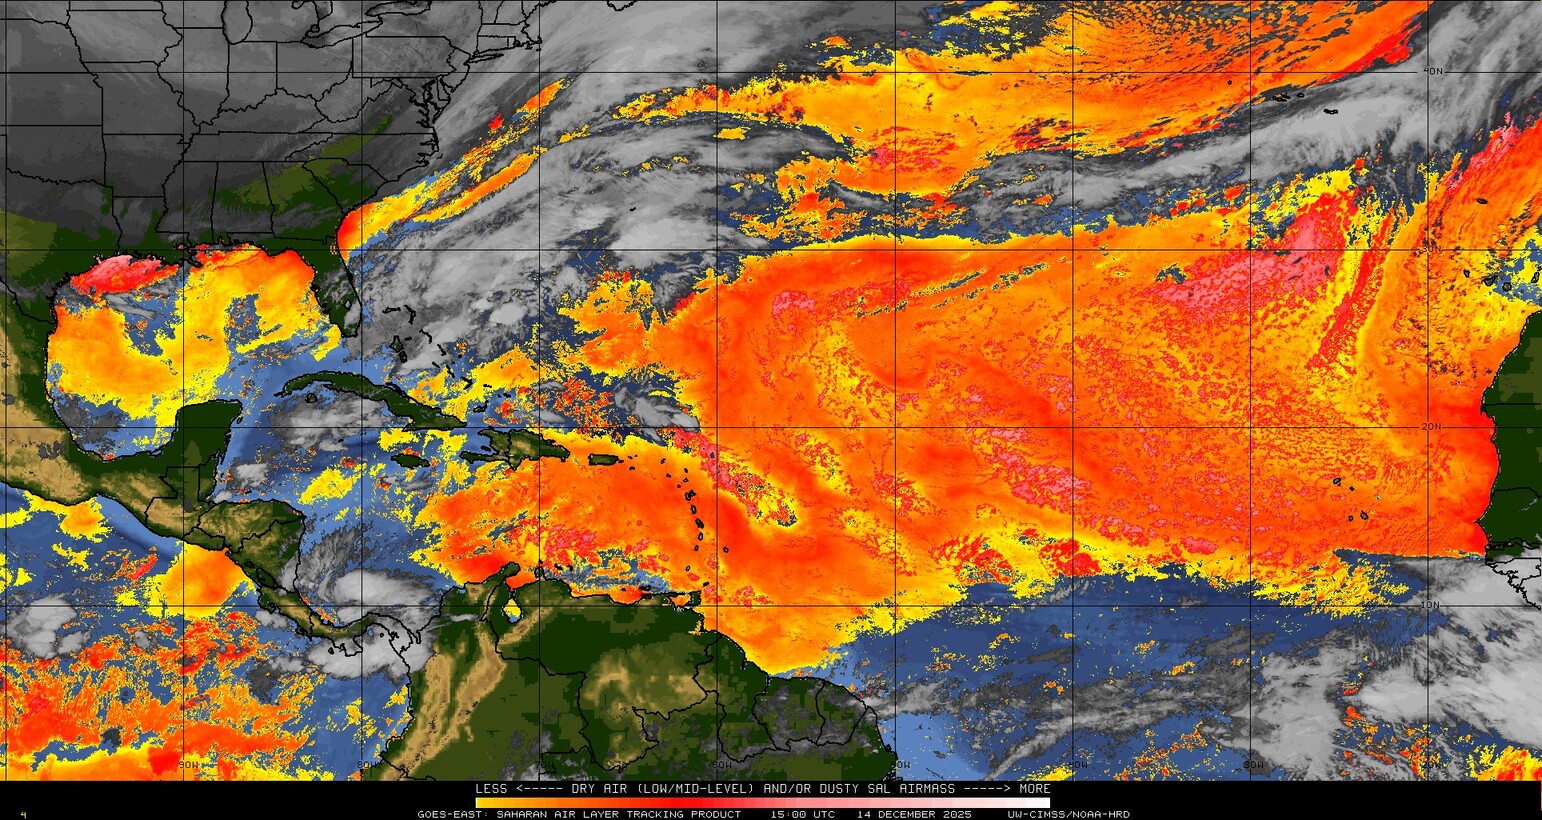
Saharan Air Layer (SAL) Analysis:
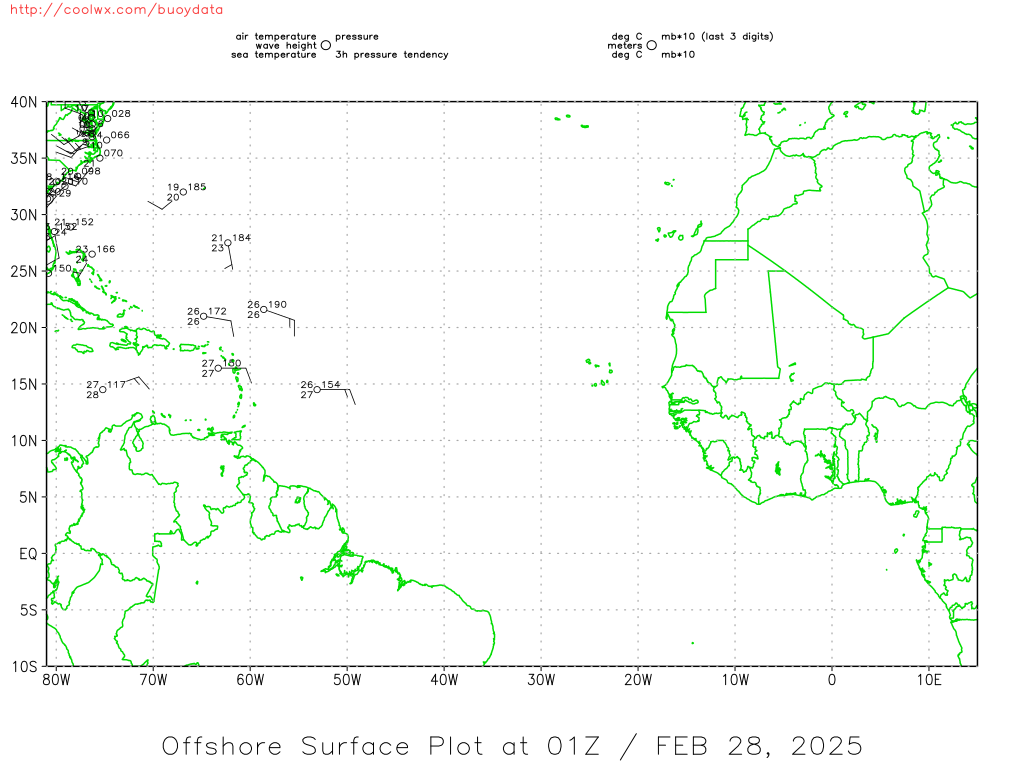
Current Tropical Atlantic Surface Weather Analysis:

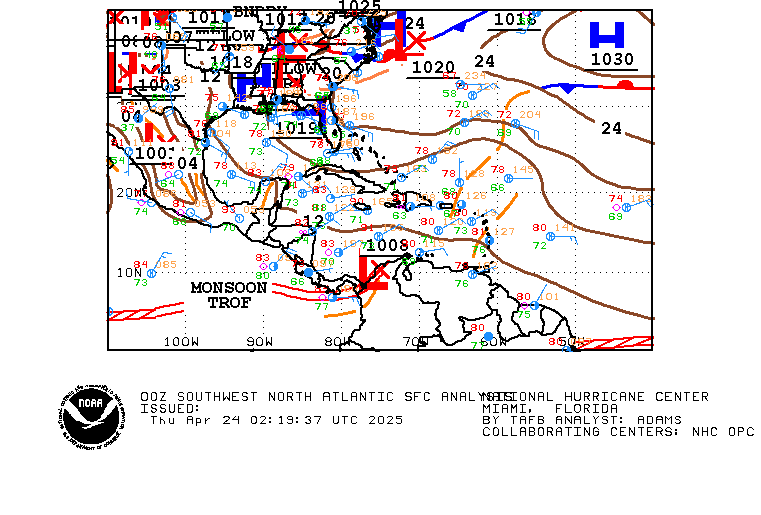
Current Southwest North Atlantic Surface Analysis:
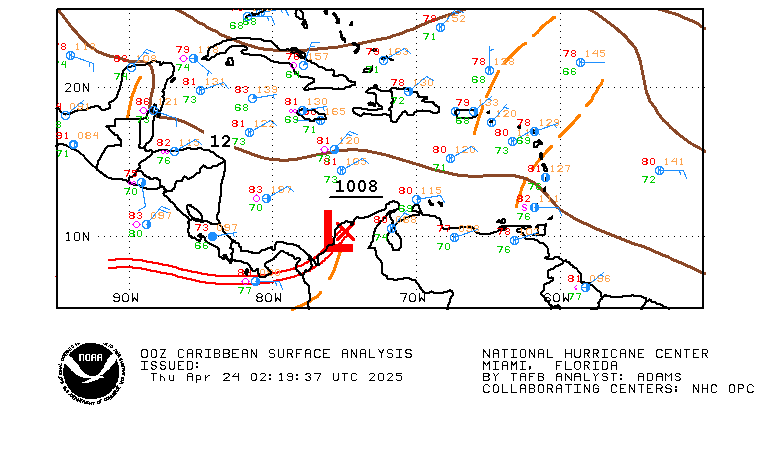
Current Caribbean Surface Analysis:
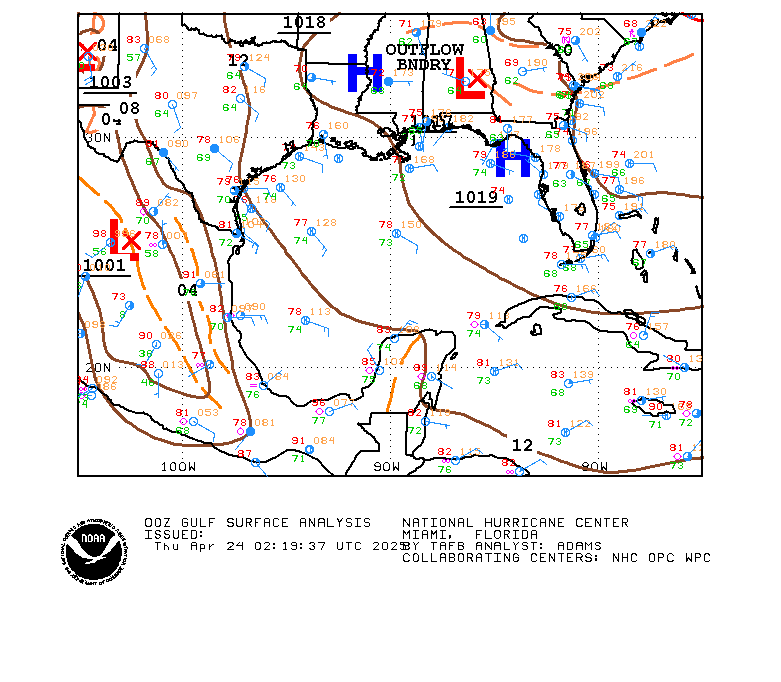
Current Gulf of Mexico Surface Analysis:
Current Southeast US Surface Map:
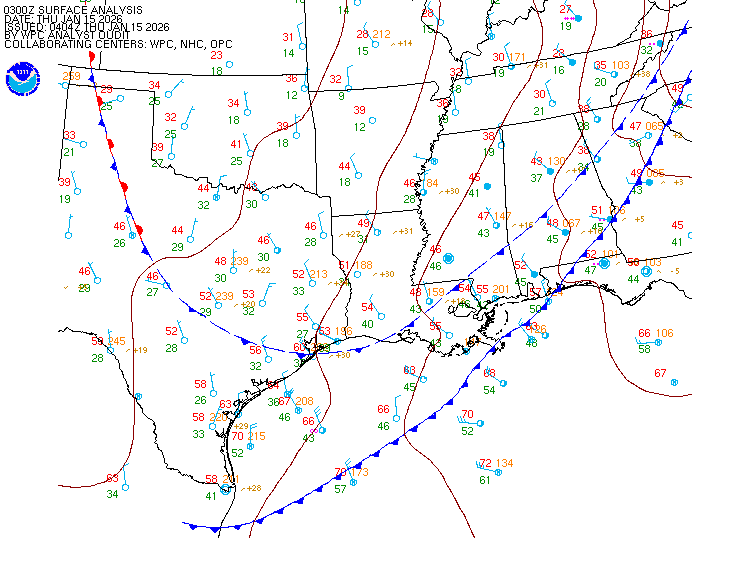
Current Northern/Western Gulf Coast Surface Map:
Western Atlantic Wind and Wave Analysis:

Current Atlantic Sea State Analysis:

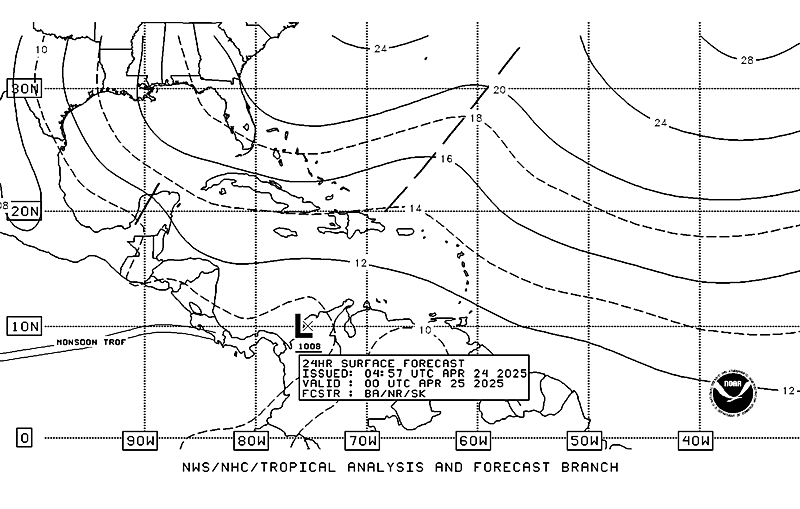
24 Hour NHC Surface Forecast:
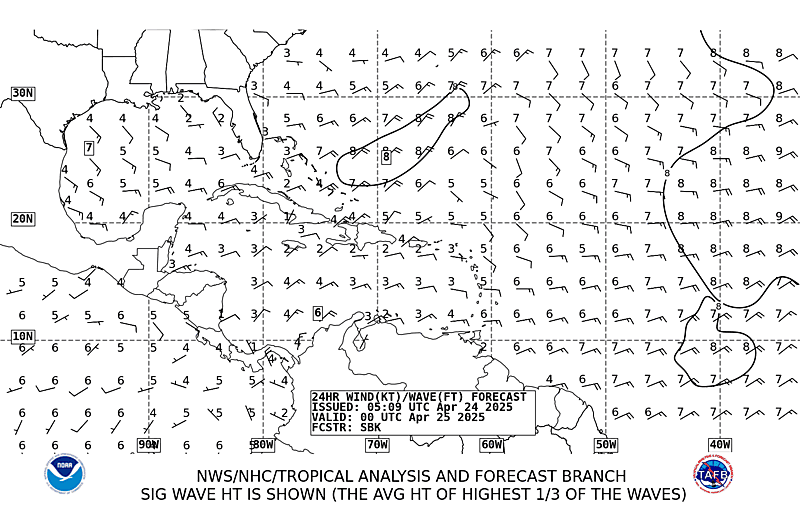
24 Hour NHC Wind & Wave Forecast:
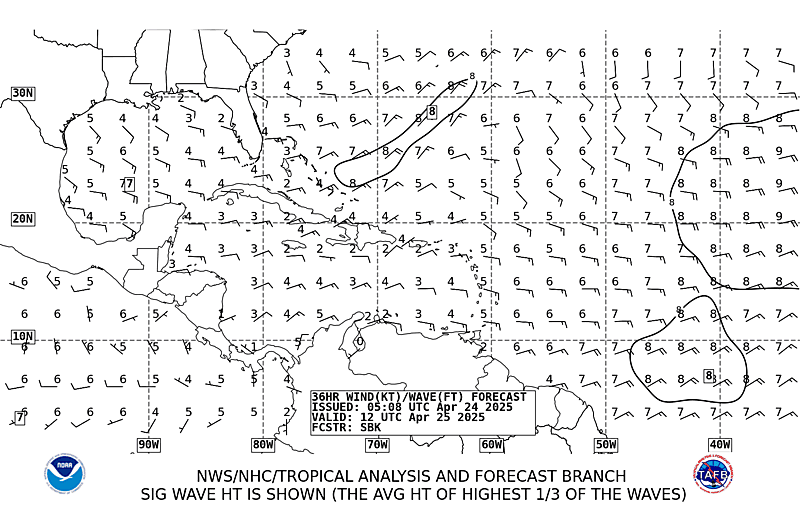
36 Hour NHC Wind & Wave Forecast:
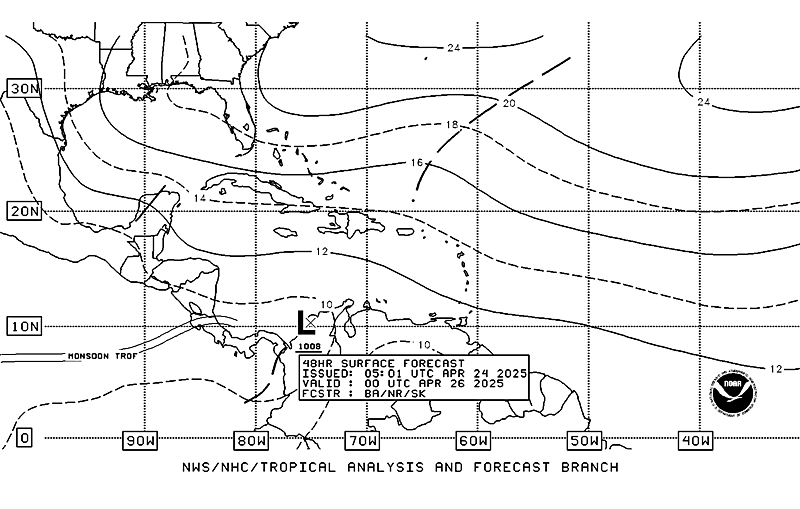
48 Hour NHC Surface Forecast:
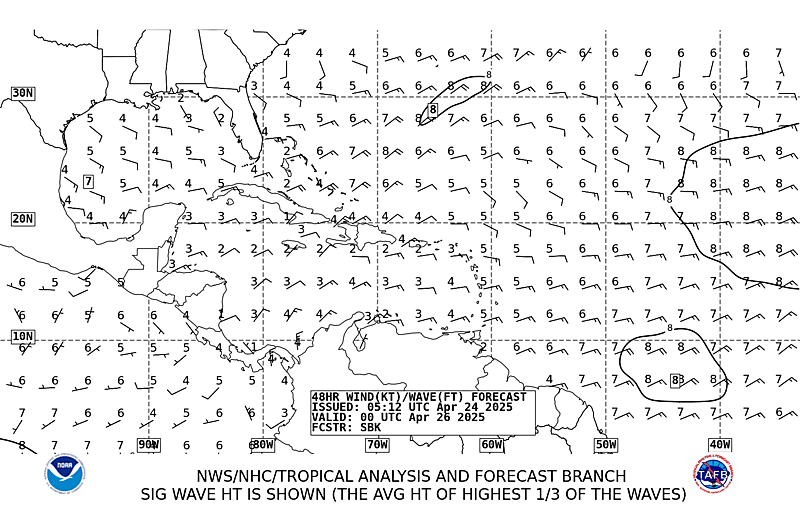
48 Hour NHC Wind & Wave Forecast:
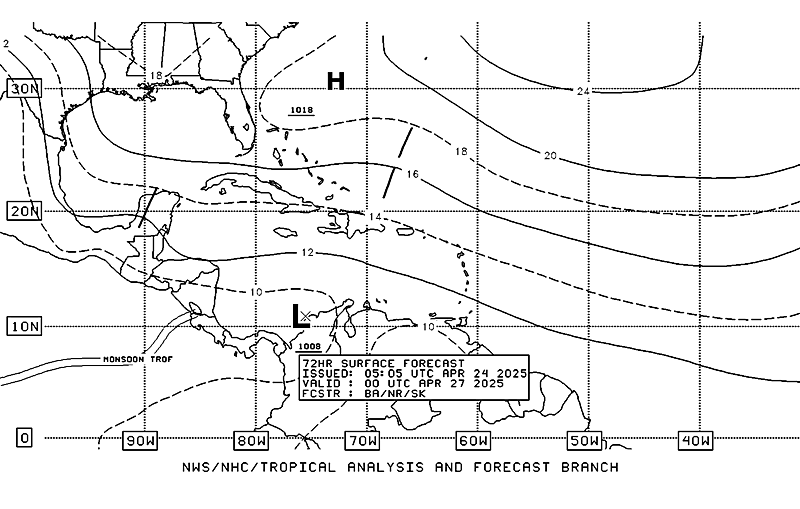
72 Hour NHC Surface Forecast:
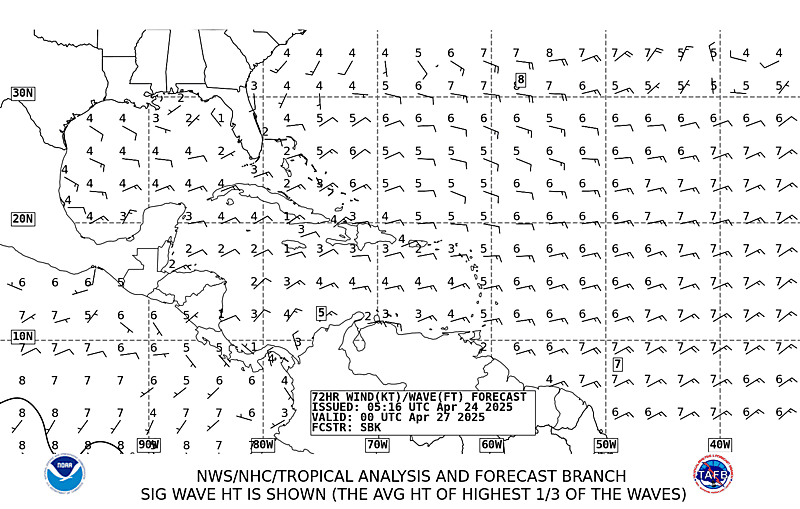
72 Hour NHC Wind & Wave Forecast:
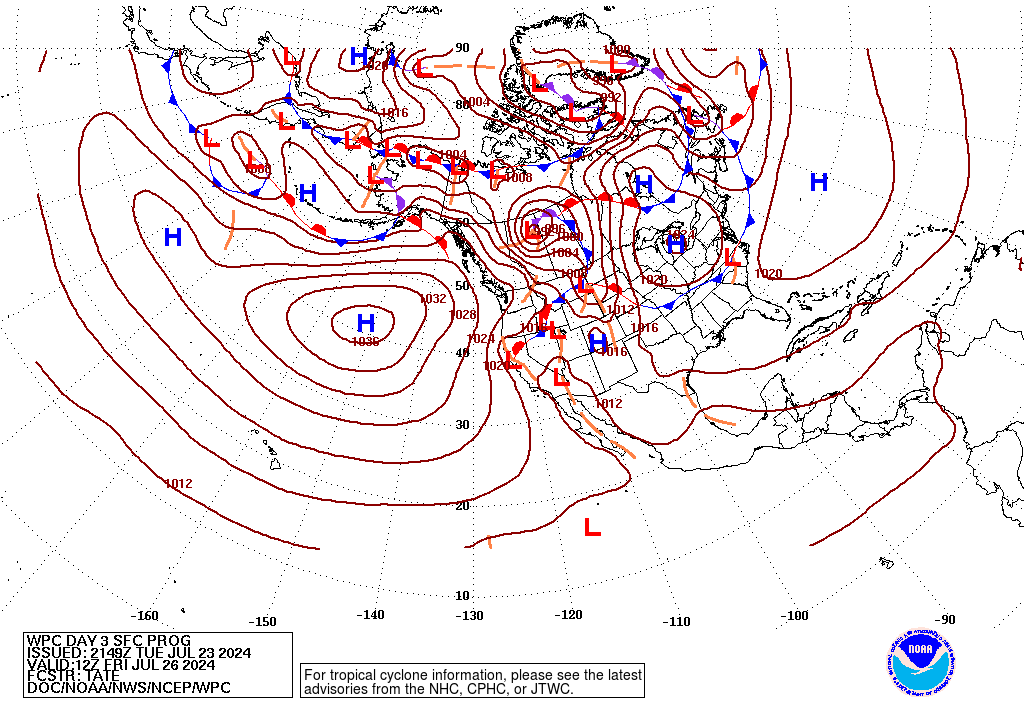
Day 3 Forecast Surface Weather Map:
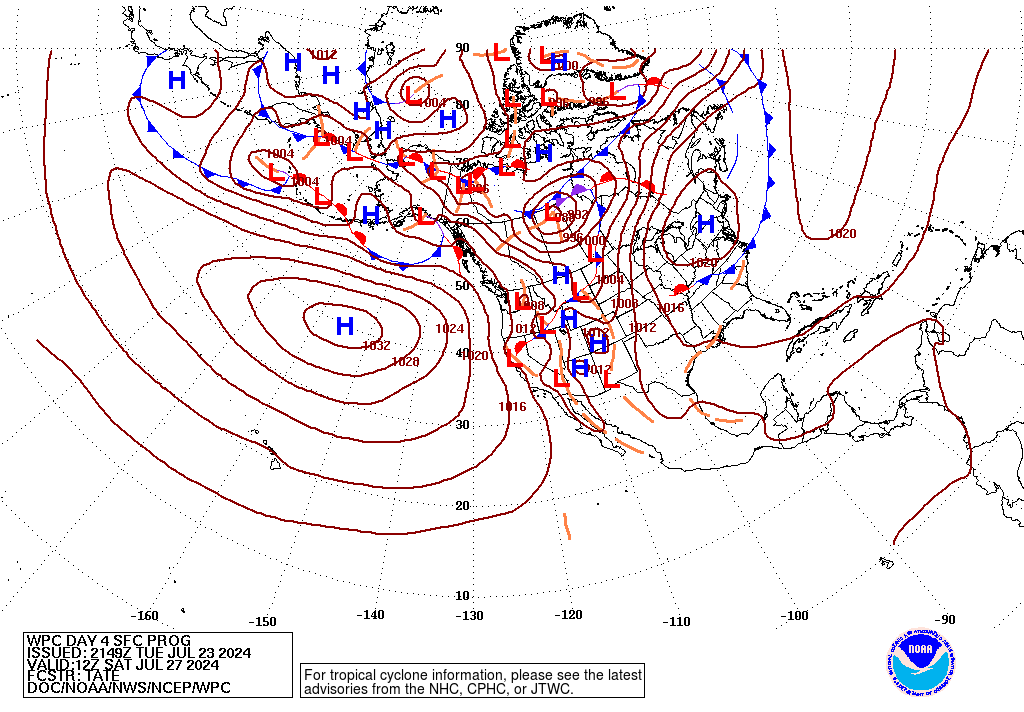
Day 4 Forecast Surface Weather Map:
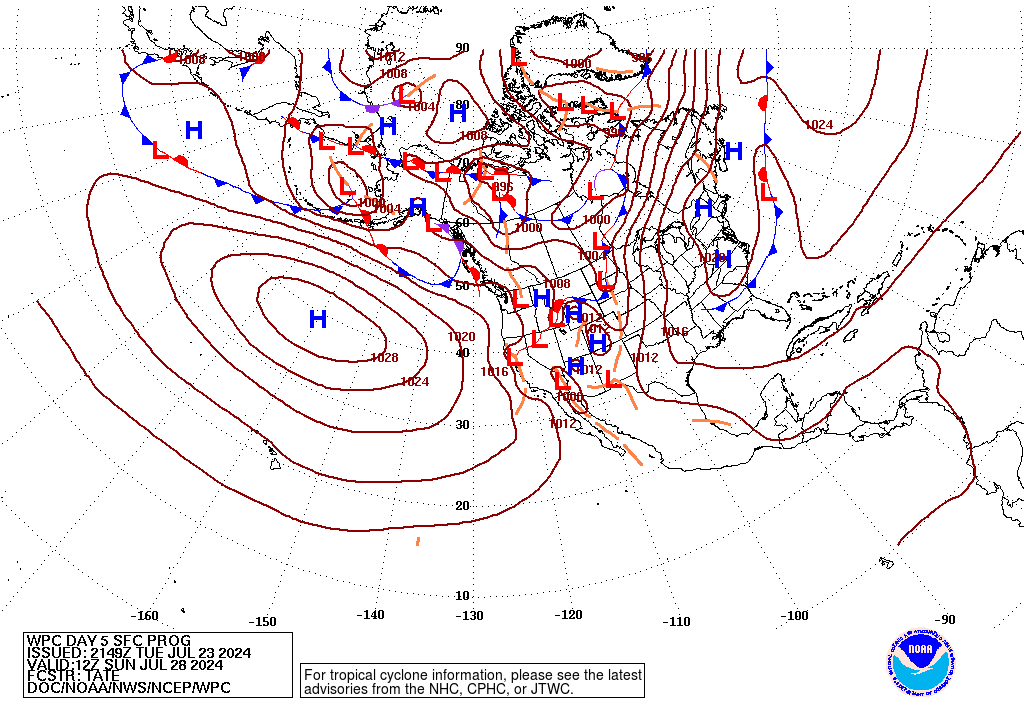
Day 5 Forecast Surface Weather Map:
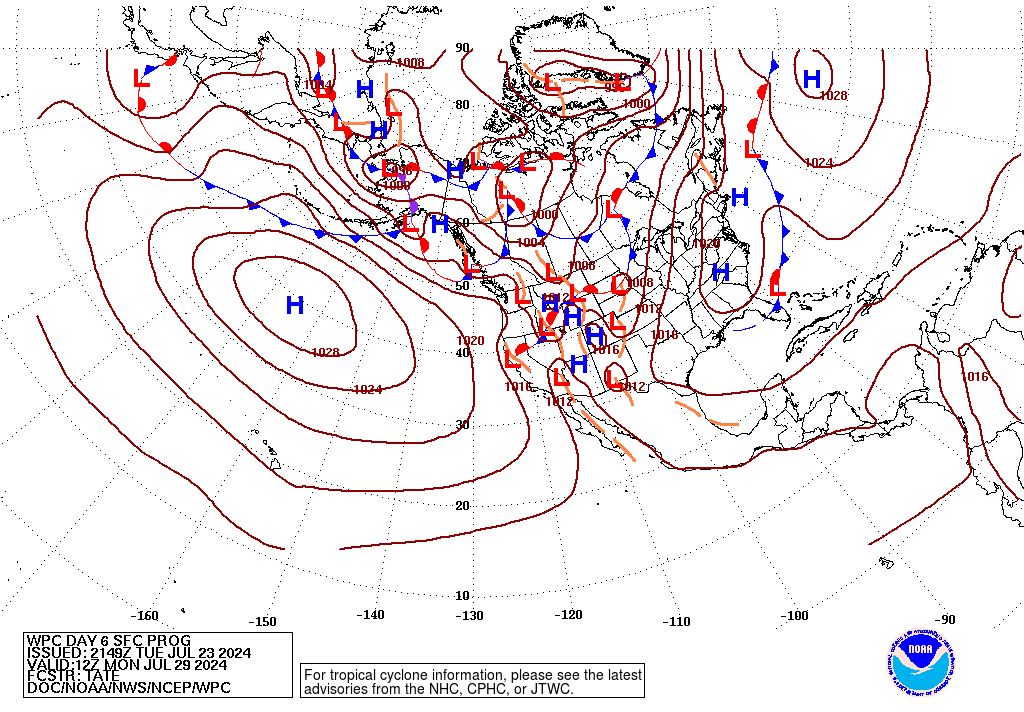
Day 6 Forecast Surface Weather Map:
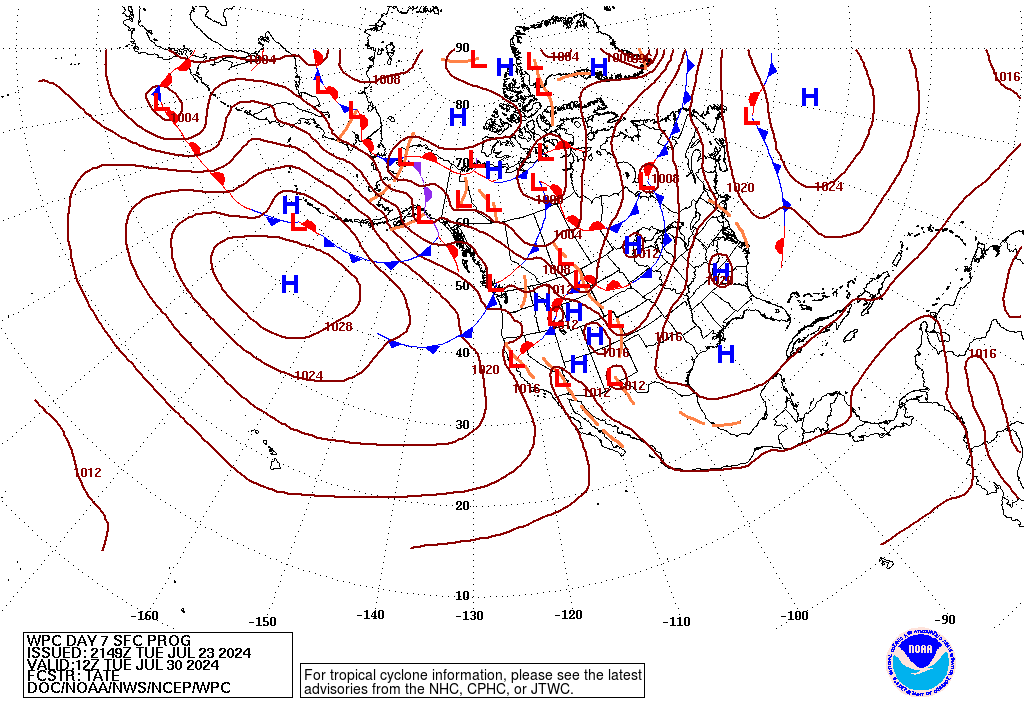
Day 7 Forecast Surface Weather Map:
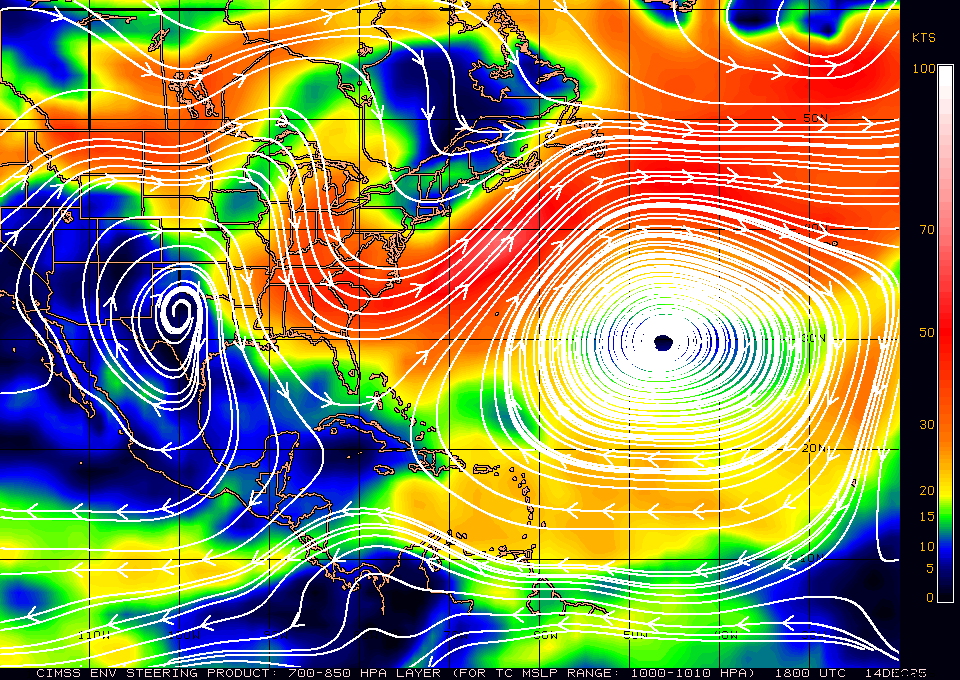
Current Atlantic 700-850 mb Mean Wind Analysis (TC Sfc Pressure Range 1000-1010 mbs):
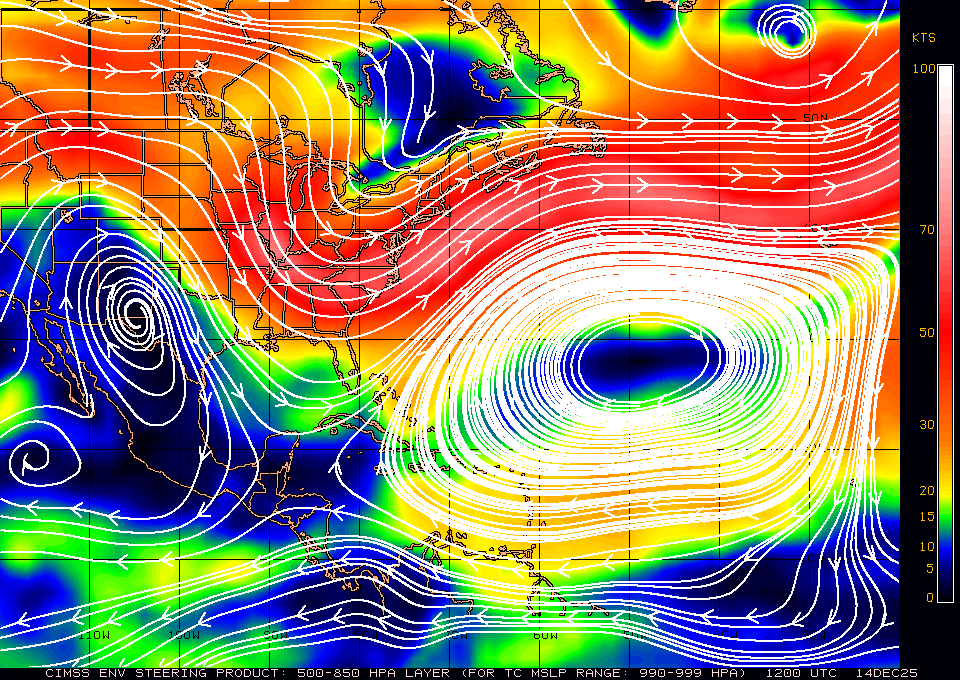
Current Atlantic 500-850 mb Mean Wind Analysis (TC Sfc Pressure Range 990-999 mbs):
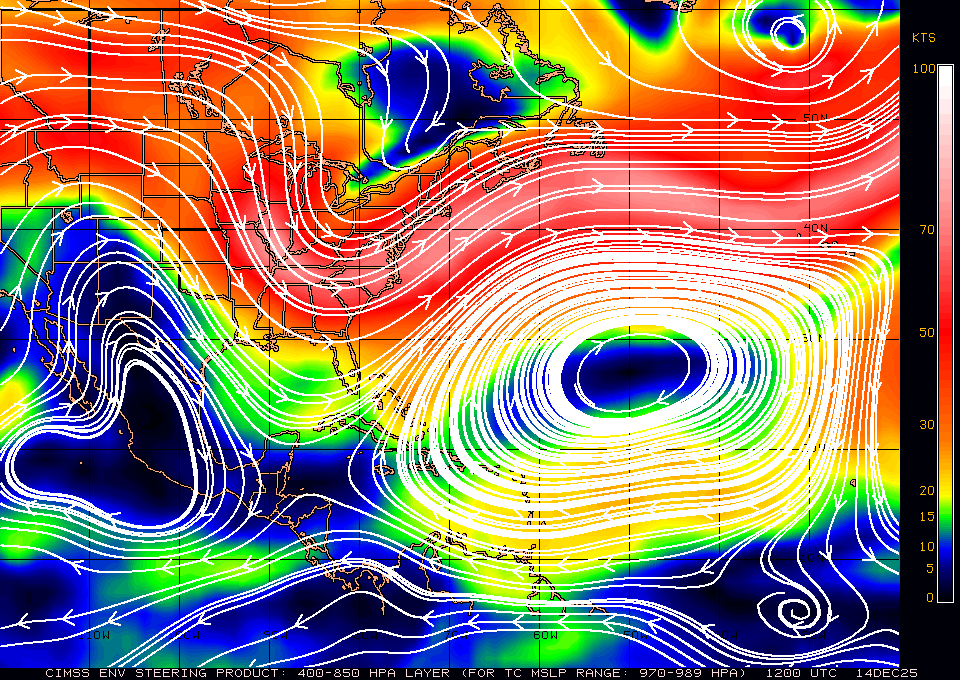
Current Atlantic 400-850 mb Mean Wind Analysis (TC Sfc Pressure Range 970-989 mbs):
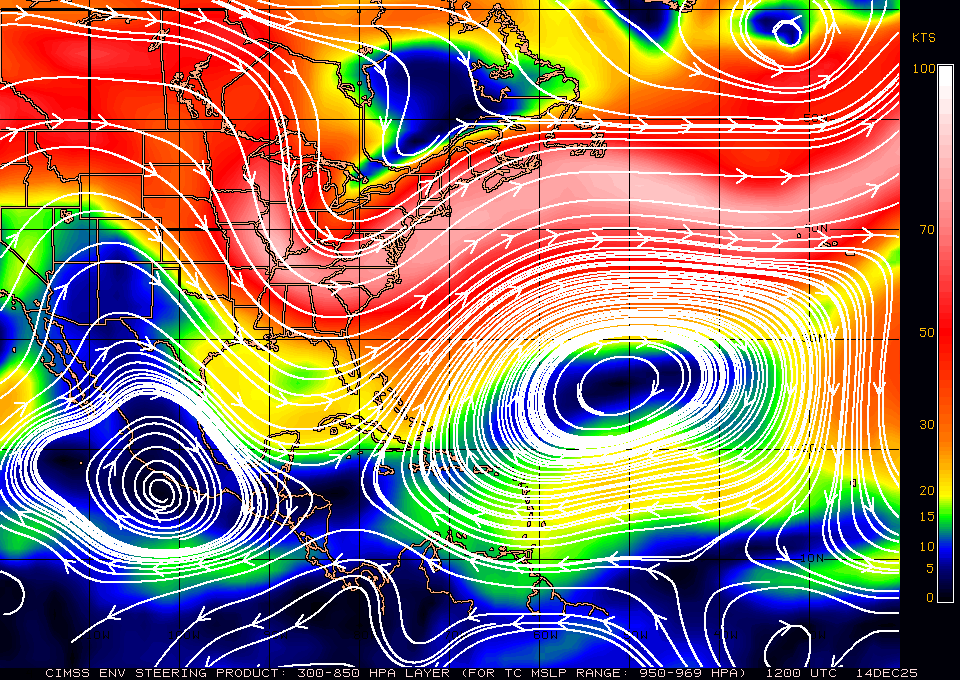
Current Atlantic 300-850 mb Mean Wind Analysis (TC Sfc Pressure Range 950-969 mbs):
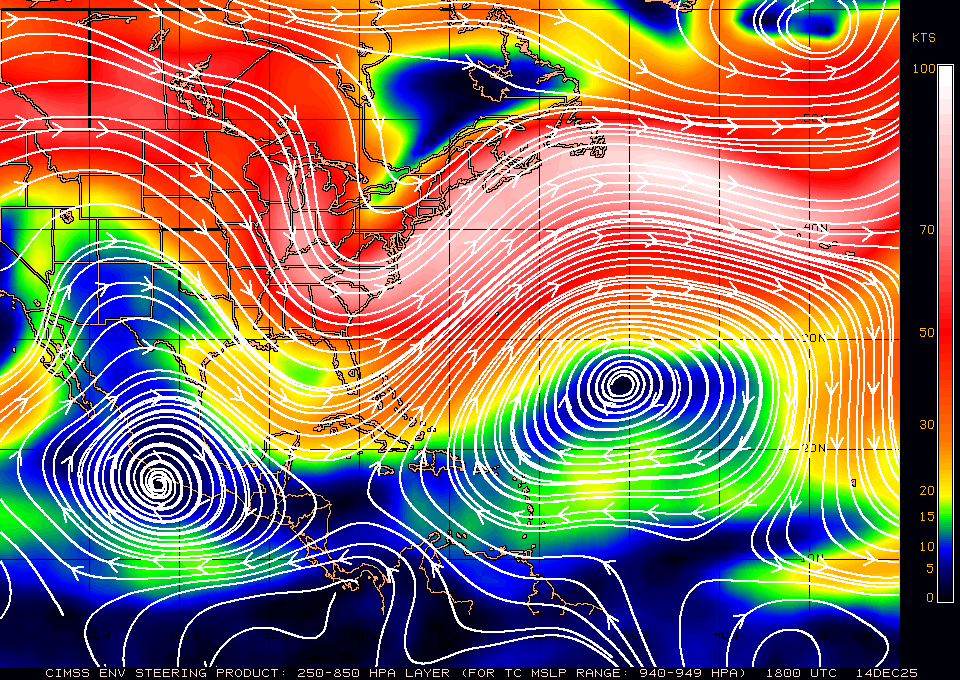
Current Atlantic 250-850 mb Mean Wind Analysis (TC Sfc Pressure Range 940-949 mbs):
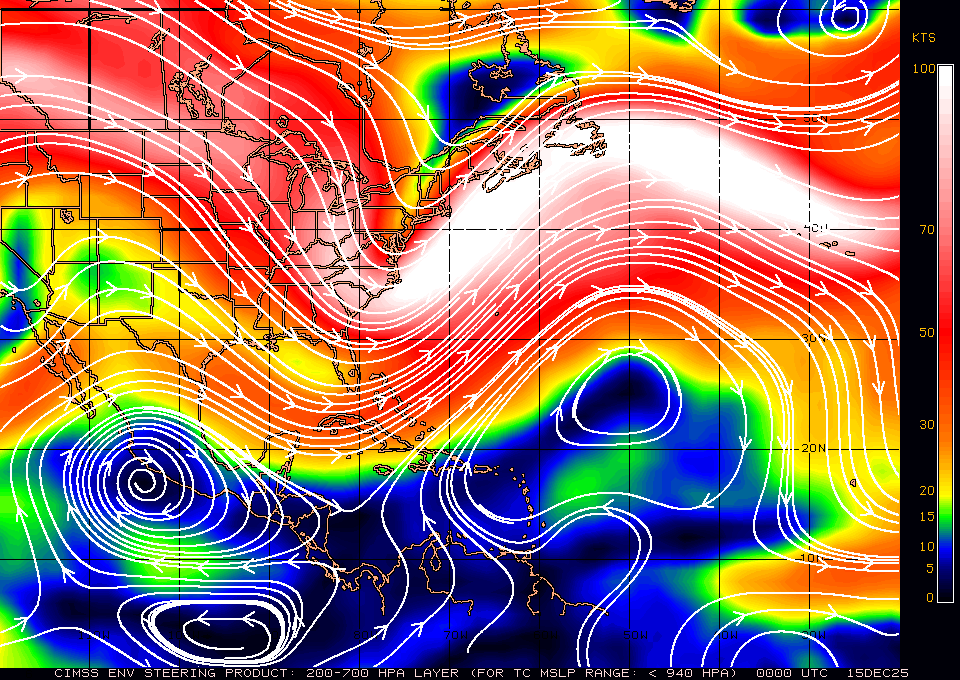
Current Atlantic 200-700 mb Mean Wind Analysis (TC Sfc Pressure Range <940 mbs):
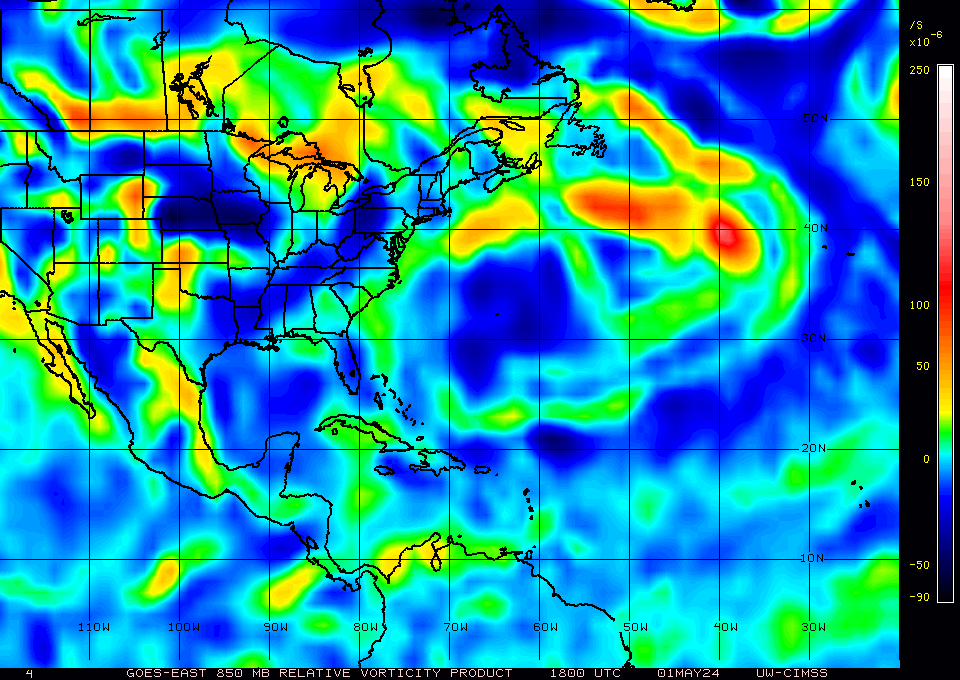
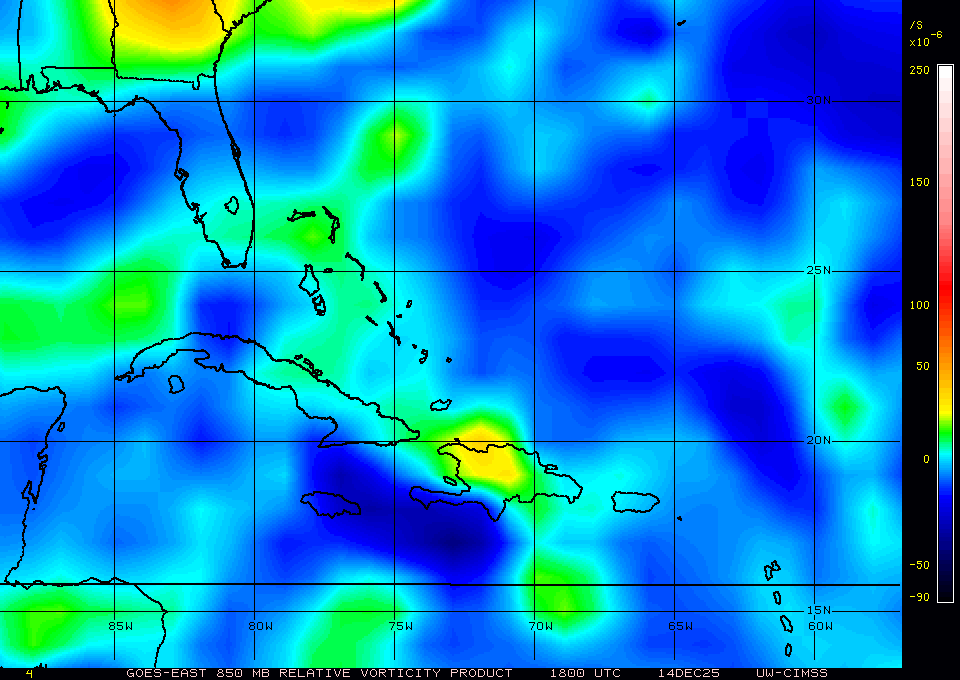
Current Atlantic 850 mb Relative Vorticity Analysis:
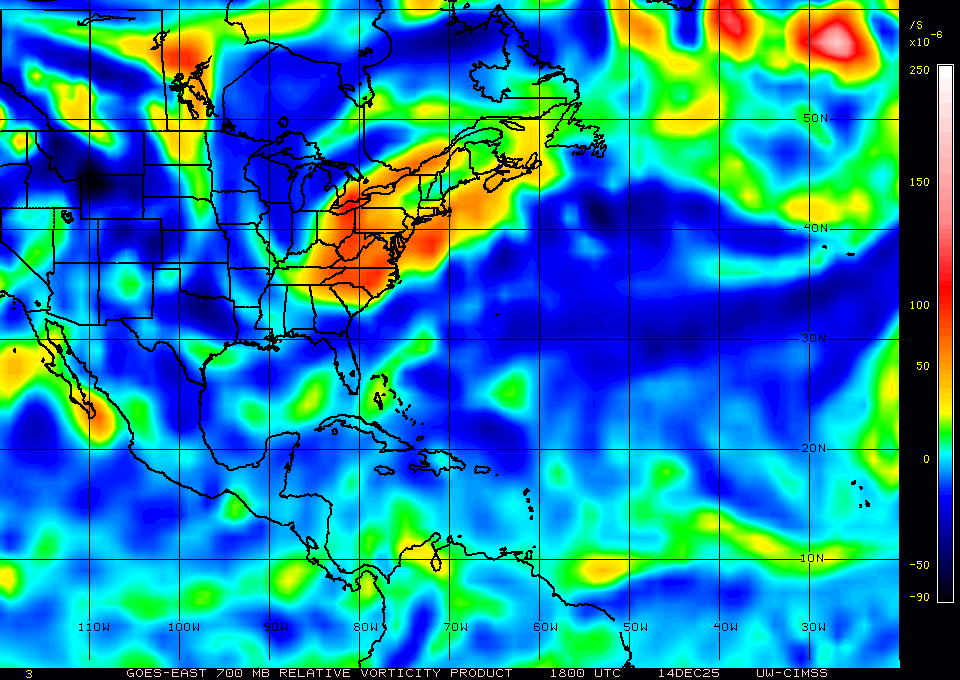
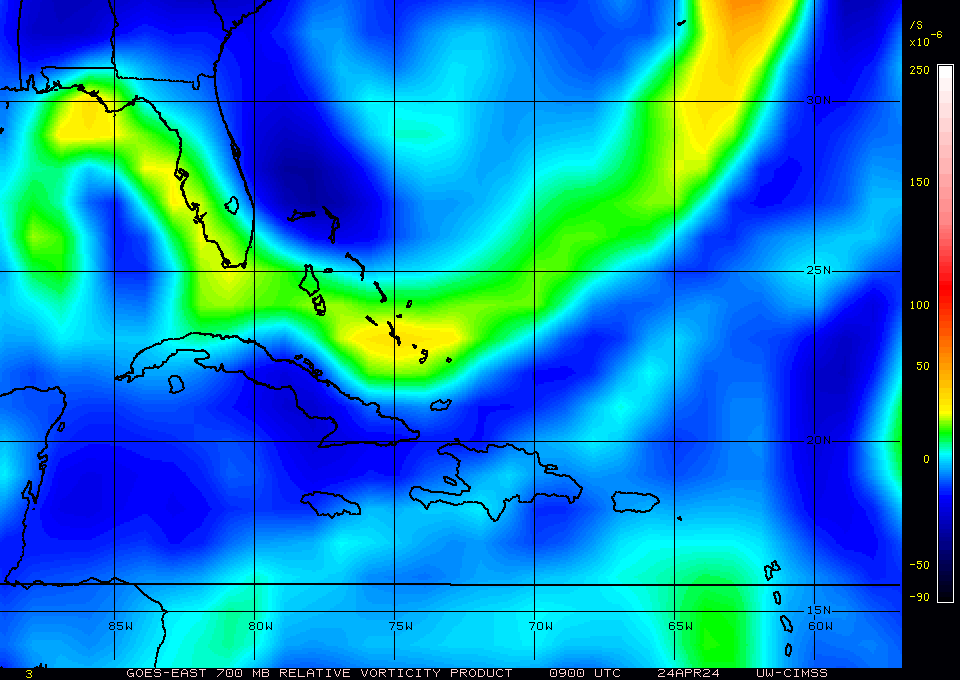
Current Atlantic 700 mb Relative Vorticity Analysis:
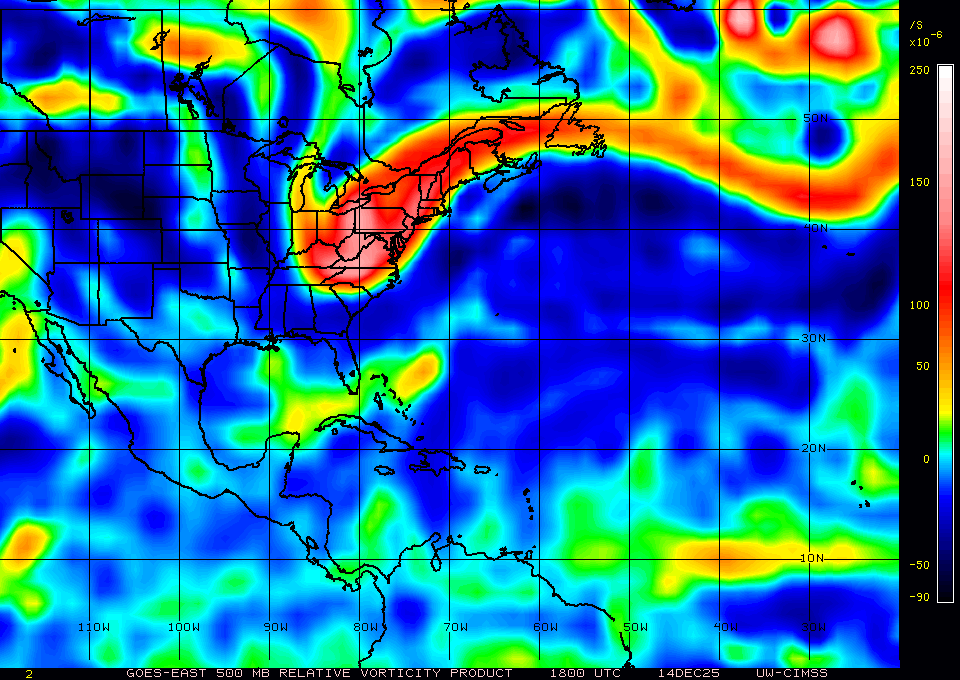
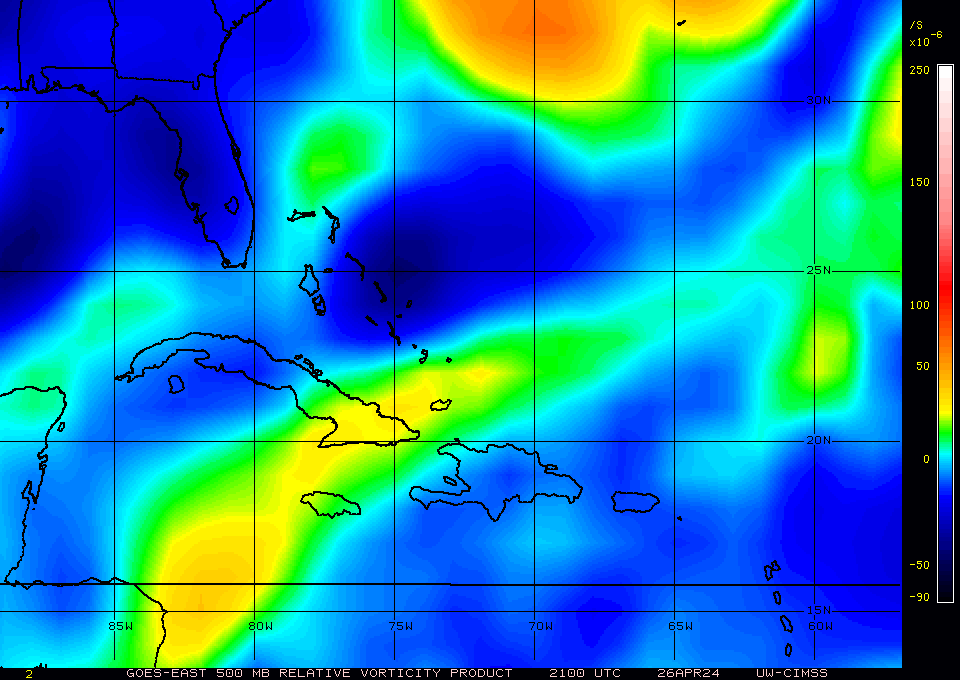
Current Atlantic 500 mb Relative Vorticity Analysis:
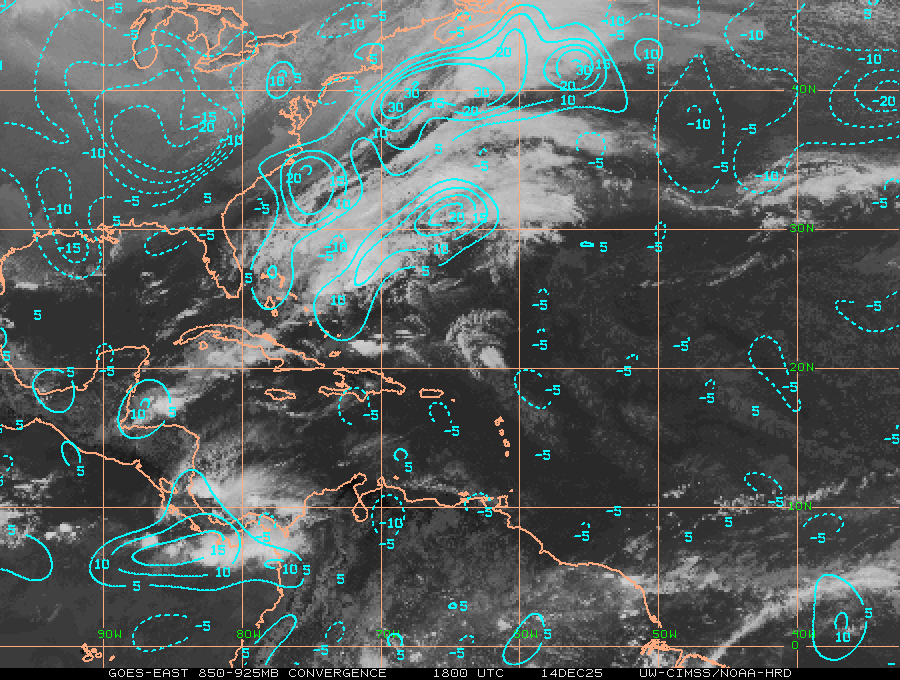
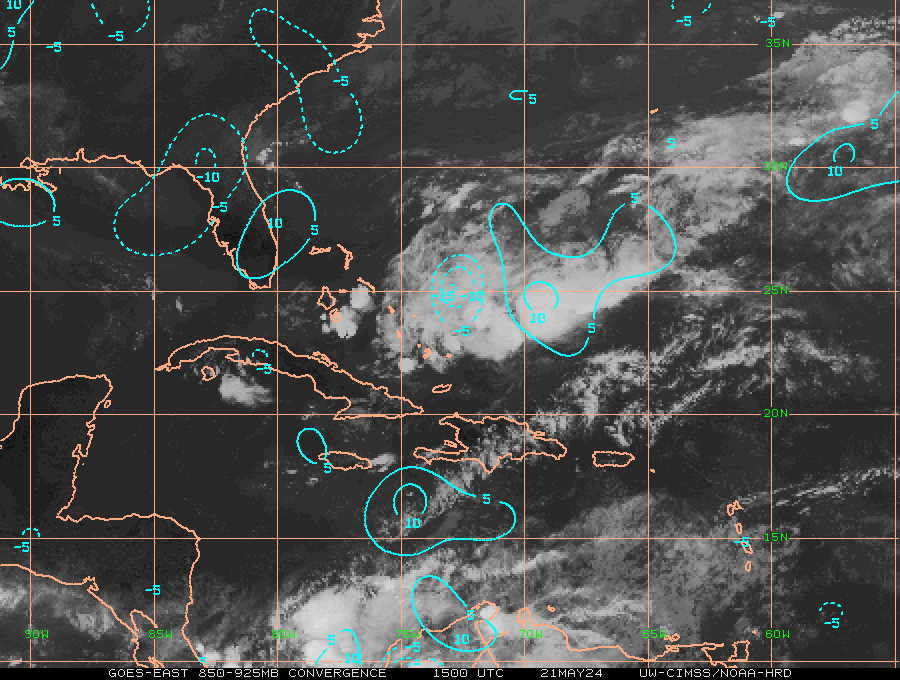
Current Atlantic Low-Level Convergence Analysis:
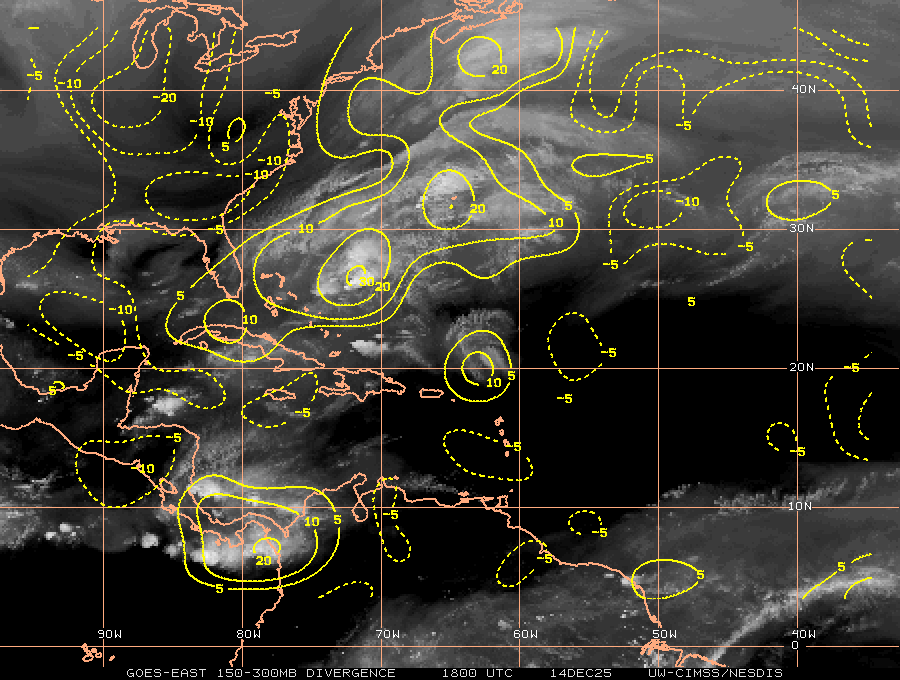
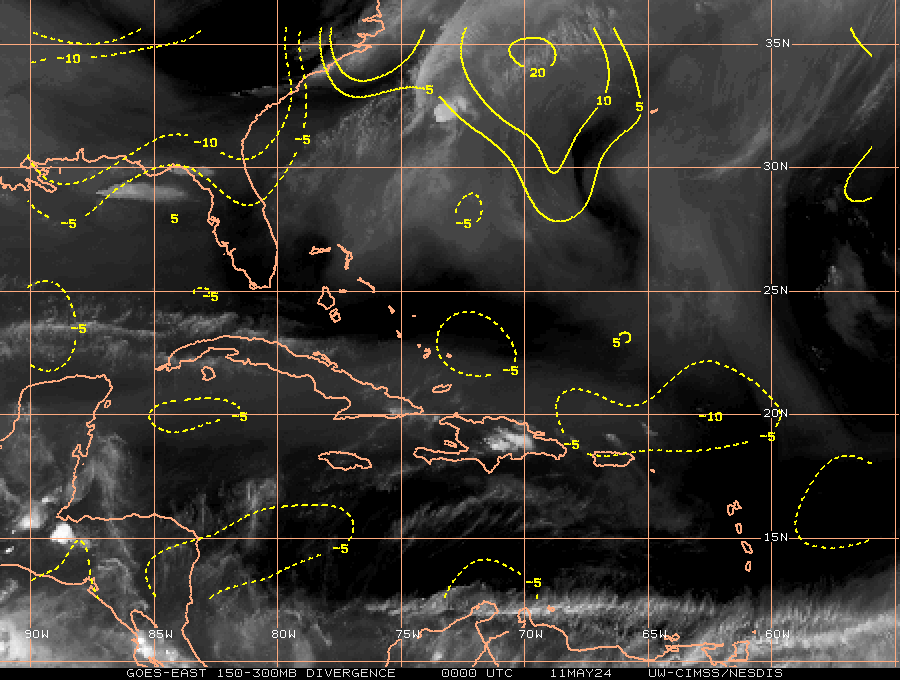
Current Atlantic Upper-Level Divergence Analysis:
Probability Of Tropical Cyclone Formation Within 24 Hours:

Probability Of Tropical Cyclone Formation In 24 To 48 Hours:

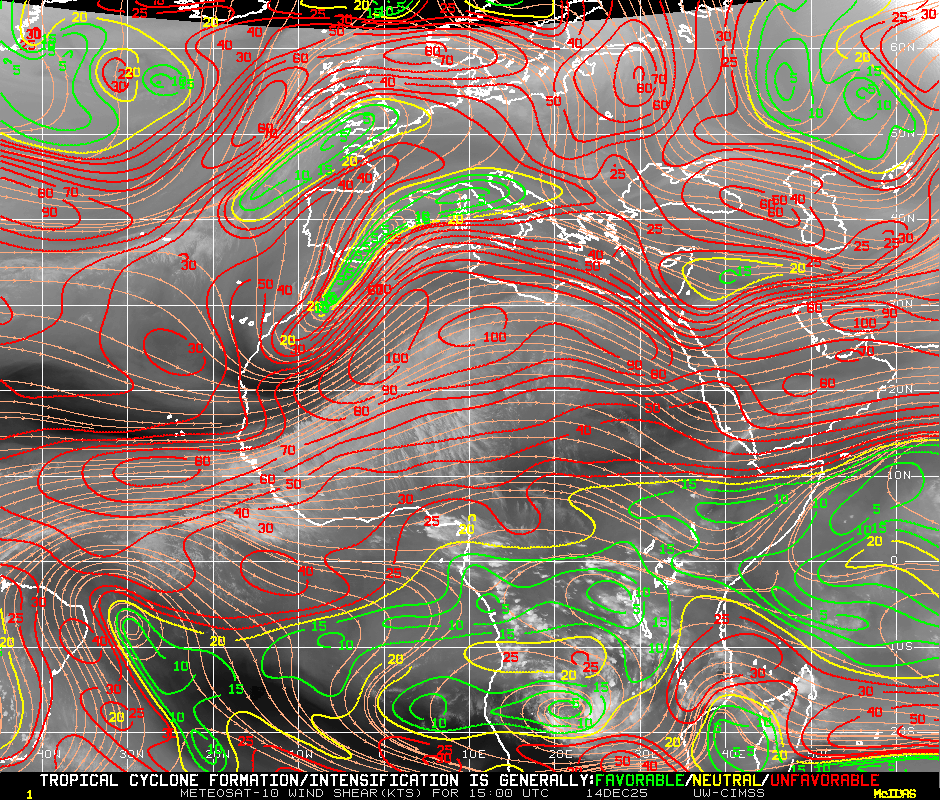
Vertical Wind Shear Forecast (850-200 mbs) For The Next 24 Hours:

Vertical Wind Shear Forecast (850-200 mbs) For 24 To 48 Hours:

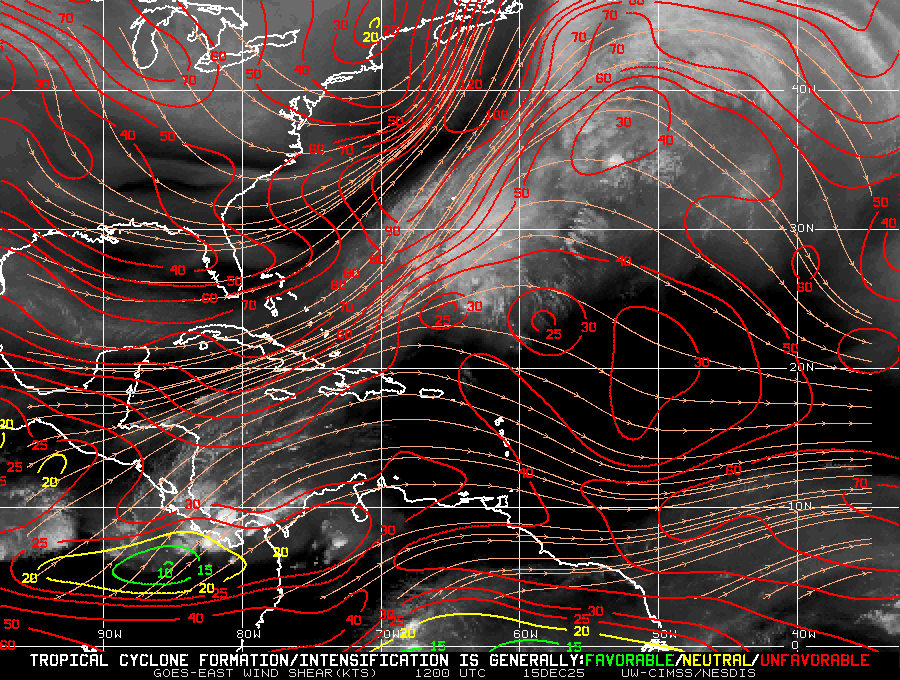
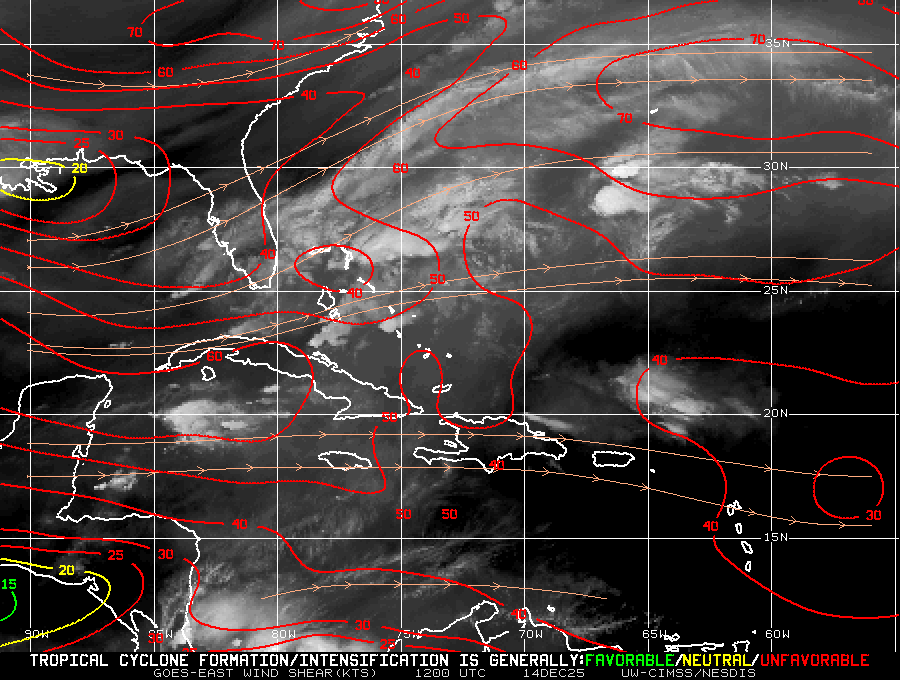
Current Atlantic Wind Shear Analysis:
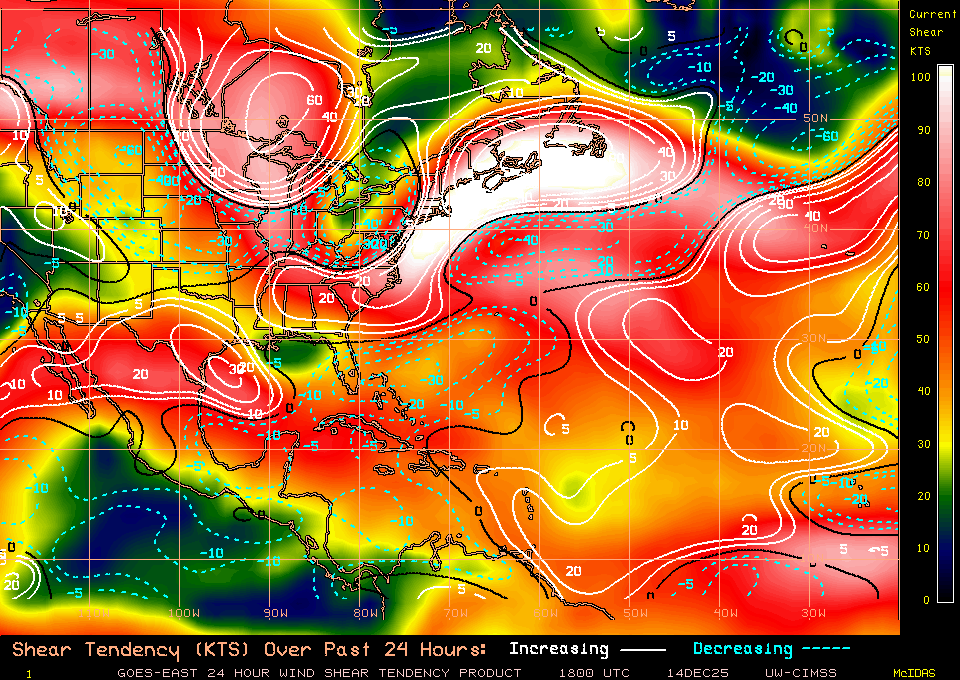
Current Atlantic Wind Shear Tendency Analysis:
Current Eastern Atlantic/African Wind Shear Analysis:
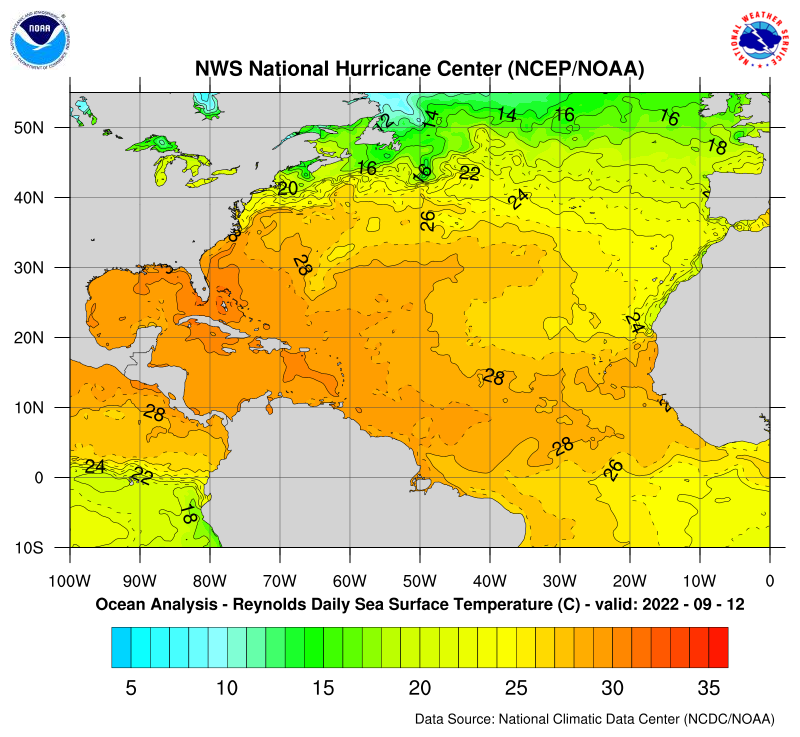
Current Sea Surface Temperature Analysis:

![]()
Tropical Weather Overview:
What Is A Tropical Depression, Tropical Storm Or A Hurricane:
Tropical Depression
A tropical cyclone in which the maximum sustained wind speed is 38 mph or less (33 kt or less or 17 m/s or less). Depressions have a closed circulation.
Tropical Storm
A tropical cyclone in which the maximum sustained wind speed ranges from 39 mph (34 kt or 18 m/s) to 73 mph (63 kt or 33 m/s). The convection in tropical storms is usually more concentrated near the center with outer rainfall organizing into distinct bands.
Hurricane
When winds in a tropical cyclone equal or exceed 74 mph (64 kt or 34 m/s) it is called a hurricane. Hurricanes are further designated by categories on the Saffir-Simpson scale. Hurricanes in categories 3, 4, 5 are known as Major Hurricanes or Intense Hurricanes.
The Saffir-Simpson Hurricane Wind Scale:
The Saffir-Simpson Hurricane Wind Scale is a 1 to 5 categorization based on the hurricane’s intensity at the indicated time. The scale provides examples of the type of damages and impacts in the United States associated with winds of the indicated intensity. In general, damages rise by about a factor of four for every category increase. The maximum sustained surface wind speed (peak 1-minute wind at 10 m [33 ft]) is the determining factor in the scale. The scale does not address the potential for such other hurricane-related impacts, as storm surge, rainfall-induced floods, and tornadoes. These wind-caused impacts are to apply to the worst winds reaching the coast and the damage would be less elsewhere. It should also be noted that the general wind-caused damage descriptions are to some degree dependent upon the local building codes in effect and how well and how long they have been enforced. Hurricane wind damage is also dependent upon such other factors as duration of high winds, change of wind direction, amount of accompanying rainfall, and age of structures.
Category One Hurricane: Sustained Winds 74-95 mph (64-82 kt or 119-153 km/hr).
Very dangerous winds will produce some damage
People, livestock, and pets struck by flying or falling debris could be injured or killed. Older (mainly pre-1994 construction) mobile homes could be destroyed, especially if they are not anchored properly as they tend to shift or roll off their foundations. Newer mobile homes that are anchored properly can sustain damage involving the removal of shingle or metal roof coverings, and loss of vinyl siding, as well as damage to carports, sunrooms, or lanais. Some poorly constructed frame homes can experience major damage, involving loss of the roof covering and damage to gable ends as well as the removal of porch coverings and awnings. Unprotected windows may break if struck by flying debris. Masonry chimneys can be toppled. Well-constructed frame homes could have damage to roof shingles, vinyl siding, soffit panels, and gutters. Failure of aluminum, screened-in, swimming pool enclosures can occur. Some apartment building and shopping center roof coverings could be partially removed. Industrial buildings can lose roofing and siding especially from windward corners, rakes, and eaves. Failures to overhead doors and unprotected windows will be common. Windows in high-rise buildings can be broken by flying debris. Falling and broken glass will pose a significant danger even after the storm. There will be occasional damage to commercial signage, fences, and canopies. Large branches of trees will snap and shallow rooted trees can be toppled. Extensive damage to power lines and poles will likely result in power outages that could last a few to several days. Hurricane Dolly (2008) is an example of a hurricane that brought Category 1 winds and impacts to South Padre Island, Texas.
Category Two Hurricane: Sustained Winds 96-110 mph (83-95 kt or 154-177 km/hr).
Extremely dangerous winds will cause extensive damage
There is a substantial risk of injury or death to people, livestock, and pets due to flying and falling debris. Older (mainly pre-1994 construction) mobile homes have a very high chance of being destroyed and the flying debris generated can shred nearby mobile homes. Newer mobile homes can also be destroyed. Poorly constructed frame homes have a high chance of having their roof structures removed especially if they are not anchored properly. Unprotected windows will have a high probability of being broken by flying debris. Well-constructed frame homes could sustain major roof and siding damage. Failure of aluminum, screened-in, swimming pool enclosures will be common. There will be a substantial percentage of roof and siding damage to apartment buildings and industrial buildings. Unreinforced masonry walls can collapse. Windows in high-rise buildings can be broken by flying debris. Falling and broken glass will pose a significant danger even after the storm. Commercial signage, fences, and canopies will be damaged and often destroyed. Many shallowly rooted trees will be snapped or uprooted and block numerous roads. Near-total power loss is expected with outages that could last from several days to weeks. Potable water could become scarce as filtration systems begin to fail. Hurricane Frances (2004) is an example of a hurricane that brought Category 2 winds and impacts to coastal portions of Port St. Lucie, Florida with Category 1 conditions experienced elsewhere in the city.
Category Three Hurricane: Sustained Winds 111-129 mph (96-112 kt or 178-208 km/hr).
Devastating damage will occur
There is a high risk of injury or death to people, livestock, and pets due to flying and falling debris. Nearly all older (pre-1994) mobile homes will be destroyed. Most newer mobile homes will sustain severe damage with potential for complete roof failure and wall collapse. Poorly constructed frame homes can be destroyed by the removal of the roof and exterior walls. Unprotected windows will be broken by flying debris. Well-built frame homes can experience major damage involving the removal of roof decking and gable ends. There will be a high percentage of roof covering and siding damage to apartment buildings and industrial buildings. Isolated structural damage to wood or steel framing can occur. Complete failure of older metal buildings is possible, and older unreinforced masonry buildings can collapse. Numerous windows will be blown out of high-rise buildings resulting in falling glass, which will pose a threat for days to weeks after the storm. Most commercial signage, fences, and canopies will be destroyed. Many trees will be snapped or uprooted, blocking numerous roads. Electricity and water will be unavailable for several days to a few weeks after the storm passes. Hurricane Ivan (2004) is an example of a hurricane that brought Category 3 winds and impacts to coastal portions of Gulf Shores, Alabama with Category 2 conditions experienced elsewhere in this city.
Category Four Hurricane: Sustained Winds 130-156 mph (113-136 kt or 209-251 km/hr).
Catastrophic damage will occur.
There is a very high risk of injury or death to people, livestock, and pets due to flying and falling debris. Nearly all older (pre-1994) mobile homes will be destroyed. A high percentage of newer mobile homes also will be destroyed. Poorly constructed homes can sustain complete collapse of all walls as well as the loss of the roof structure. Well-built homes also can sustain severe damage with loss of most of the roof structure and/or some exterior walls. Extensive damage to roof coverings, windows, and doors will occur. Large amounts of windborne debris will be lofted into the air. Windborne debris damage will break most unprotected windows and penetrate some protected windows. There will be a high percentage of structural damage to the top floors of apartment buildings. Steel frames in older industrial buildings can collapse. There will be a high percentage of collapse to older unreinforced masonry buildings. Most windows will be blown out of high-rise buildings resulting in falling glass, which will pose a threat for days to weeks after the storm. Nearly all commercial signage, fences, and canopies will be destroyed. Most trees will be snapped or uprooted and power poles downed. Fallen trees and power poles will isolate residential areas. Power outages will last for weeks to possibly months. Long-term water shortages will increase human suffering. Most of the area will be uninhabitable for weeks or months. Hurricane Charley (2004) is an example of a hurricane that brought Category 4 winds and impacts to coastal portions of Punta Gorda, Florida with Category 3 conditions experienced elsewhere in the city.
Category Five Hurricane: Sustained Winds of 157 mph or higher (137 kt or higher or 252 km/hr or higher).
Catastrophic damage will occur.
People, livestock, and pets are at very high risk of injury or death from flying or falling debris, even if indoors in mobile homes or framed homes. Almost complete destruction of all mobile homes will occur, regardless of age or construction. A high percentage of frame homes will be destroyed, with total roof failure and wall collapse. Extensive damage to roof covers, windows, and doors will occur. Large amounts of windborne debris will be lofted into the air. Windborne debris damage will occur to nearly all unprotected windows and many protected windows. Significant damage to wood roof commercial buildings will occur due to loss of roof sheathing. Complete collapse of many older metal buildings can occur. Most unreinforced masonry walls will fail which can lead to the collapse of the buildings. A high percentage of industrial buildings and low-rise apartment buildings will be destroyed. Nearly all windows will be blown out of high-rise buildings resulting in falling glass, which will pose a threat for days to weeks after the storm. Nearly all commercial signage, fences, and canopies will be destroyed. Nearly all trees will be snapped or uprooted and power poles downed. Fallen trees and power poles will isolate residential areas. Power outages will last for weeks to possibly months. Long-term water shortages will increase human suffering. Most of the area will be uninhabitable for weeks or months. Hurricane Andrew (1992) is an example of a hurricane that brought Category 5 winds and impacts to coastal portions of Cutler Ridge, Florida with Category 4 conditions experienced elsewhere in south Miami-Dade County.
Tropical Weather Numerical Model Links:
Gulf Of Mexico Visible Satellite Image:
US East Coast Visible Satellite Image:
Caribbean Visible Satellite Image:
Tropical Atlantic Wide Water Vapor Satellite Image:
Gulf Of Mexico Water Vapor Satellite Image:
US East Coast Water Vapor Satellite Image:
Caribbean Water Vapor Satellite Image:
Eastern Atlantic Infrared Satellite Image:
Eastern Atlantic Infrared Satellite Image:
Eastern Atlantic Visible Satellite Image:
Eastern Atlantic Water Vapor Satellite Image:

Current Southwest North Atlantic Surface Analysis:
Current Caribbean Surface Analysis:
Current Gulf of Mexico Surface Analysis:
Current Southeast US Surface Map:
Current Northern/Western Gulf Coast Surface Map:
Western Atlantic Wind and Wave Analysis:
Current Atlantic Sea State Analysis:
24 Hour NHC Surface Forecast:
24 Hour NHC Wind & Wave Forecast:
36 Hour NHC Wind & Wave Forecast:
48 Hour NHC Surface Forecast:
48 Hour NHC Wind & Wave Forecast:
72 Hour NHC Surface Forecast:
72 Hour NHC Wind & Wave Forecast:
Day 3 Forecast Surface Weather Map:
Day 4 Forecast Surface Weather Map:
Day 5 Forecast Surface Weather Map:
Day 6 Forecast Surface Weather Map:
Day 7 Forecast Surface Weather Map:

Current Atlantic 500-850 mb Mean Wind Analysis (TC Sfc Pressure Range 990-999 mbs):
