Check below for a wealth of Winter Weather Information including surface weather maps, satellite images, radar images, forecasts, predictions, and more! All images, forecasts, and documents are courtesy of their respective publishers.
US Weather Advisories:

Current National Watch, Warnings, and Advisories
Current Hemispheric 500 Millibar & Surface Analysis:

Current US Surface Weather Map
Surface Weather Plots
Albany:  | Baltimore:  |
Charlotte:  | Montgomery:  |
Tampa:  | Detroit:  |
Evansville:  | Little Rock:  |
Minneapolis-St. Paul:  | Pierre:  |
Wichita:  | Austin:  |
Denver:  | Albuquerque:  |
Lewiston, ID:  | Las Vegas:  |
Hourly Mesoscale Analysis
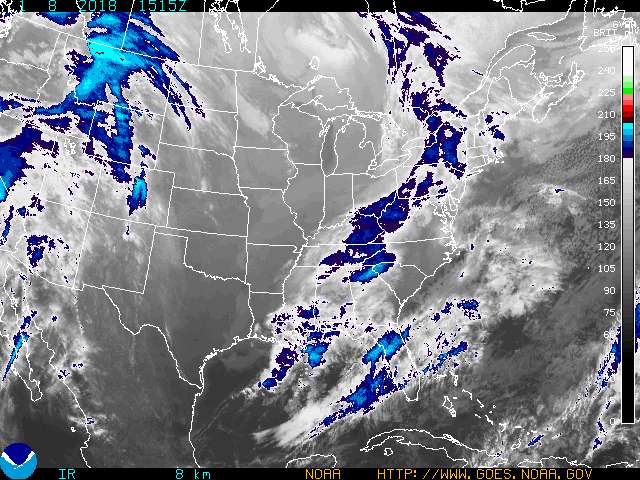
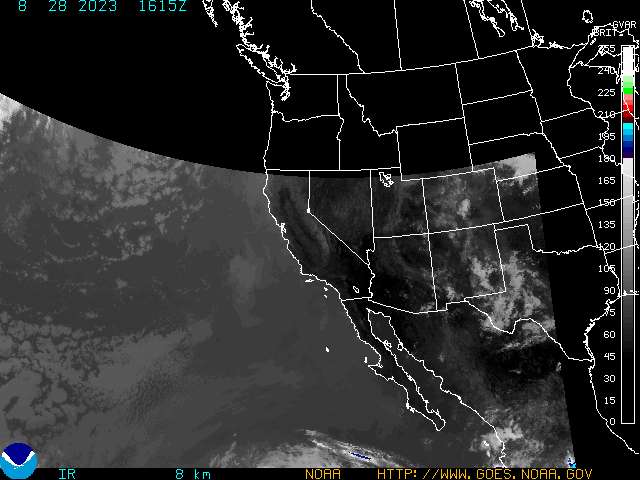
Current Infrared Satellite Images
Eastern United States
Western United States
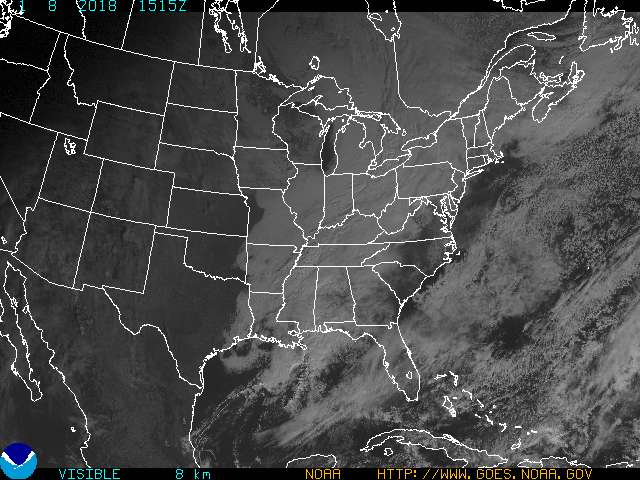
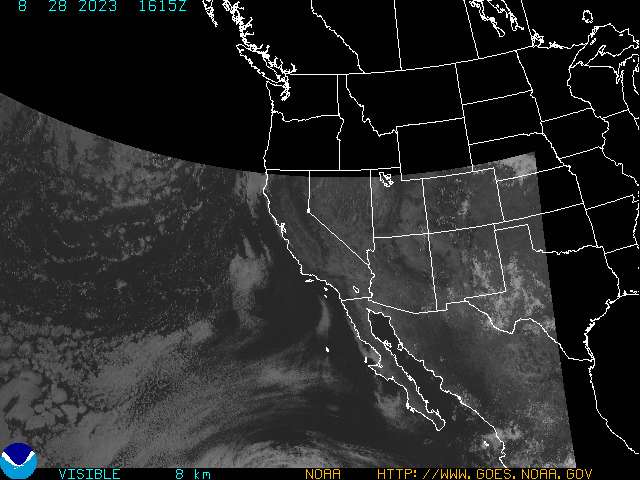
Current Visible Satellite Images
Eastern United States
Western United States
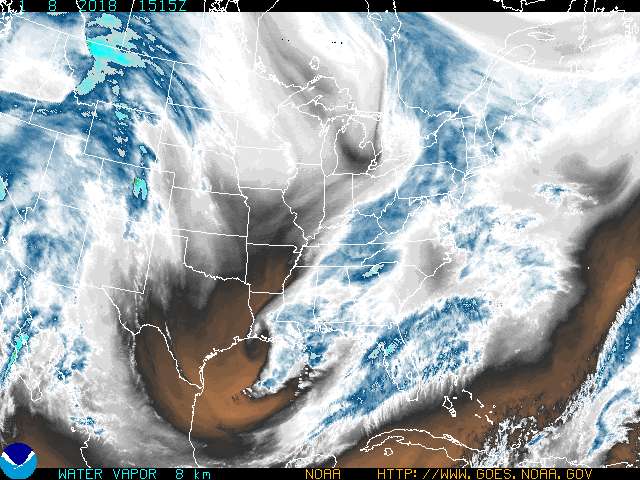
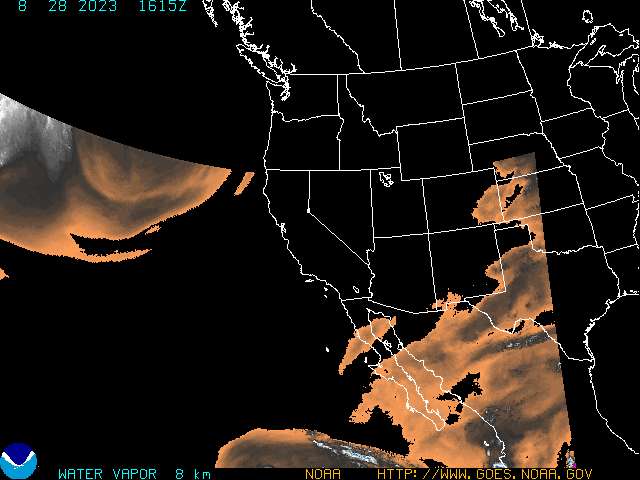
Current Water Vapor Satellite Images
Eastern United States
Western United States
Current US Radar Composites
Northeast United States

Southeast United States

Central Great Lakes

Lower Mississippi Valley

Upper Mississippi Valley

Southern Plains

Northern Rockies

Southern Rockies

Pacific Northwest

Pacific Southwest

Current National US Radar Composite
1km High Resolution Satellite and Radar Images
Current US Mesoscale Analysis:
US 2 Hour Sea Level Pressure Change Chart:
US Near Freezing Surface Temperatures:
US Critical Thickness Analysis:
Current 925 Millibar Upper Air Chart:
Current 850 Millibar Upper Air Chart:
Current 700 Millibar Upper Air Chart:
Current 500 Millibar Upper Air Chart:
Current 300 Millibar Upper Air Chart:
500 mb Upper Air Chart Overlayed On Water Vapor Satellite Image:
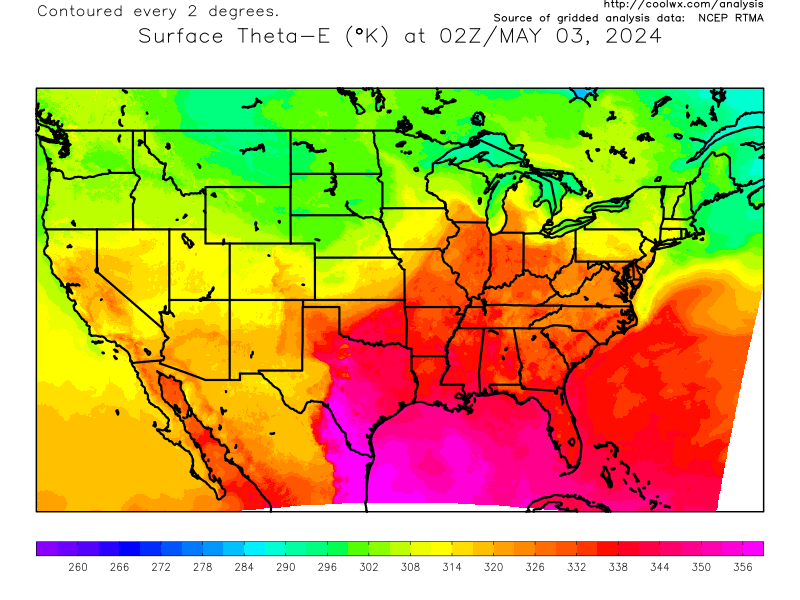
Current US Surface Theta-E Chart:
Latest Quantitative Precipitation Forecast:
Day 1 Precipitation Forecast:

Day 2 Precipitation Forecast:

Day 3 Precipitation Forecast:

3 Day Precipitation Totals:

Days 4 and 5 Precipitation Forecast:
5 Day Precipitation Totals:

Days 6 and 7 Precipitation Forecast:
7 Day Precipitation Totals:

Heavy Snowfall Discussion:
Day 1 Winter Weather Composite Forecast:
Day 2 Winter Weather Composite Forecast:
Day 3 Winter Weather Composite Forecast:
Computer Model Forecast Of Storm Tracks:
Short Range Forecast Discussion:
6 Hour Forecasted Surface Weather Map:
12 Hour Forecasted Surface Weather Map:
18 Hour Forecasted Surface Weather Map:
24 Hour Forecasted Surface Weather Map:
30 Hour Forecasted Surface Weather Map:
36 Hour Forecasted Surface Weather Map:
48 Hour Forecasted Surface Weather Map:
60 Hour Forecasted Surface Weather Map:
Extended Forecast Discussion:
Day 3 to Day 7 Forecast Surface Weather Map:
